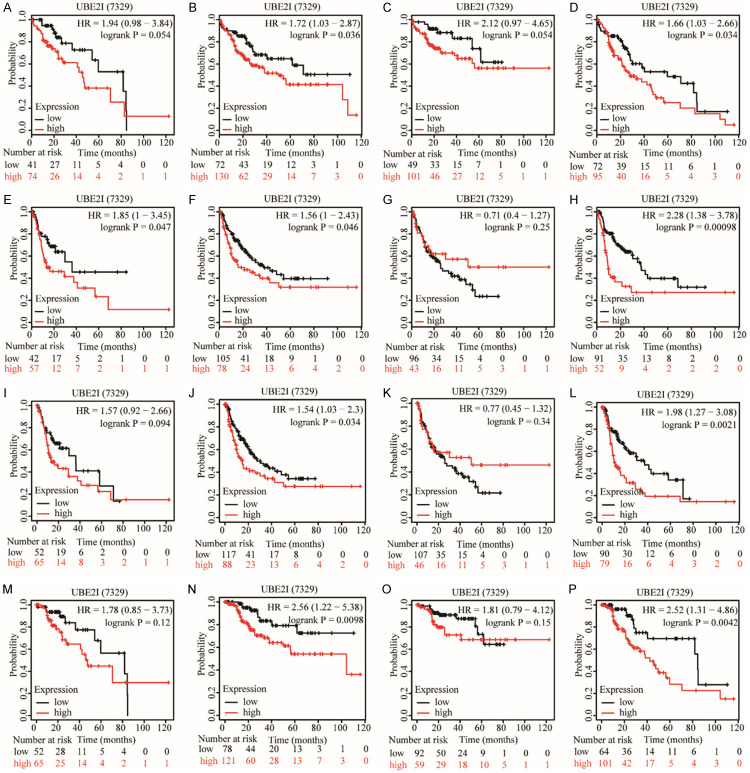
Figure 3.
Stratification analysis of UBE2I by alcohol ingestion and hepatitis status in HCC. A, E, I, M: Stratification analysis of UBE2I in a drinking population for OS (low = 41, high = 74), RFS (low = 42, high = 57), PFS (low = 52, high = 65) and DSS (low = 52, high = 65). B, F, J, N: Stratification analysis of UBE2I in a non-drinking population for OS (low = 72, high = 130), RFS (low = 105, high = 78), PFS (low = 117, high = 88) and DSS (low = 78, high = 121). C, G, K, O: Stratification analysis of UBE2I in a hepatitis patient population for OS (low = 49, high = 101), RFS (low = 96, high = 43), PFS (low = 107, high = 46) and DSS (low = 92, high = 59). D, H, L, P: Stratification analysis of UBE2I in a hepatitis-free population for OS (low = 72, high = 95), RFS (low = 91, high = 52), PFS (low = 90, high = 79) and DSS (low = 94, high = 101).

