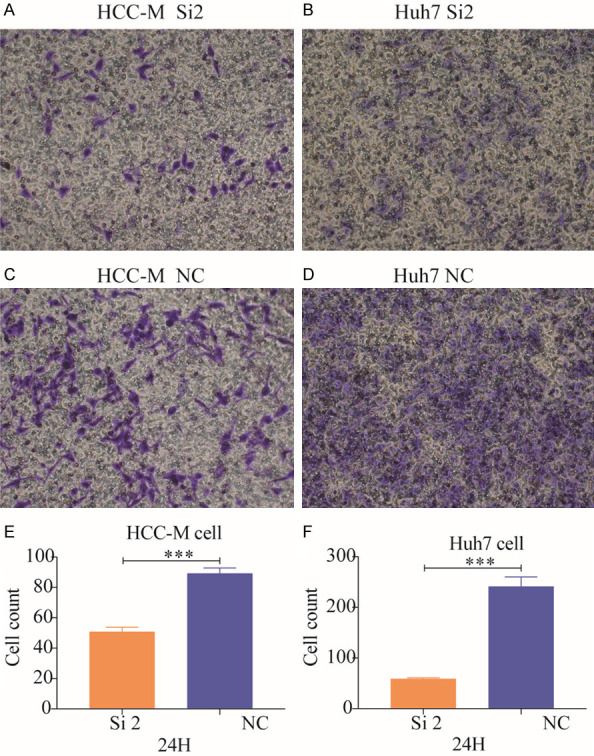
Figure 6.

Results of cell invasion assays. A, B: Results of cell invasion assays in the siRNA-2 groups of HCCM and Huh7 cells. C, D: Results of cell invasion assays in the negative control groups for HCCM and Huh7 cells. E, F: Histograms comparing the two groups of HCCM and Huh7 cells.
