
Figure 7.
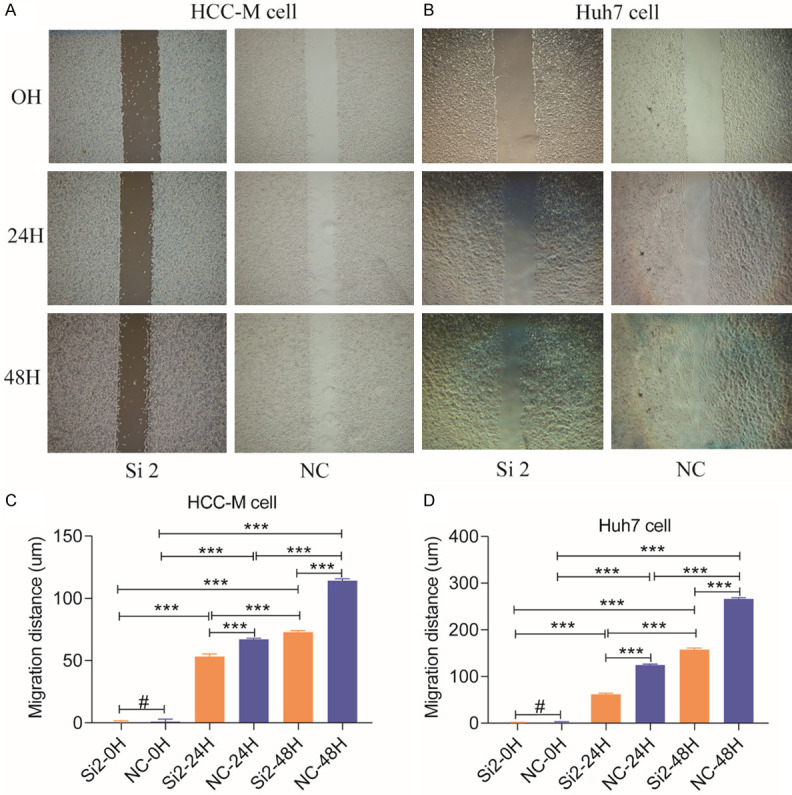
Results of cell migration assays. A, B: Results of cell invasion assays of HCCM and Huh7 cells. C, D: Histograms comparing the two groups of HCCM and Huh7 cells at 0, 24 and 48 h.
Official websites use .gov
A
.gov website belongs to an official
government organization in the United States.
Secure .gov websites use HTTPS
A lock (
) or https:// means you've safely
connected to the .gov website. Share sensitive
information only on official, secure websites.
Results of cell migration assays. A, B: Results of cell invasion assays of HCCM and Huh7 cells. C, D: Histograms comparing the two groups of HCCM and Huh7 cells at 0, 24 and 48 h.