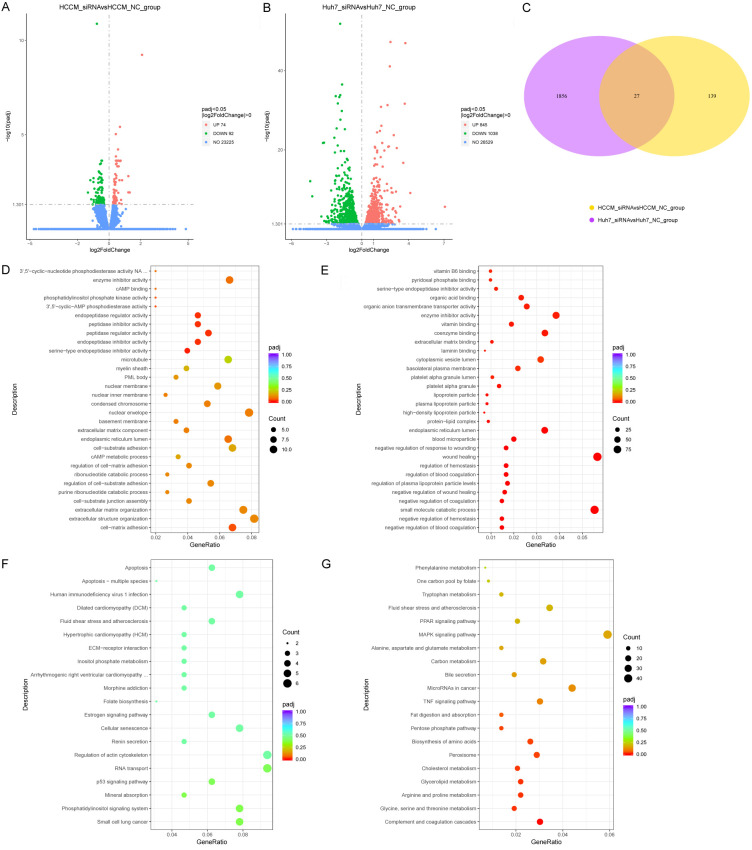
Figure 9.
Volcano plots, Venn diagram and dot plots based on DEGs in HCCM and Huh7 cells. A, B: Volcano plots in HCCM and Huh7 cells. C: Venn diagram of DEGs in HCCM and Huh7 cells. D, E: Dot plots showing enrichment of GO terms in HCCM and Huh7 cells. F, G: Dot plots showing enriched KEGG pathways in HCCM and Huh7 cells.

