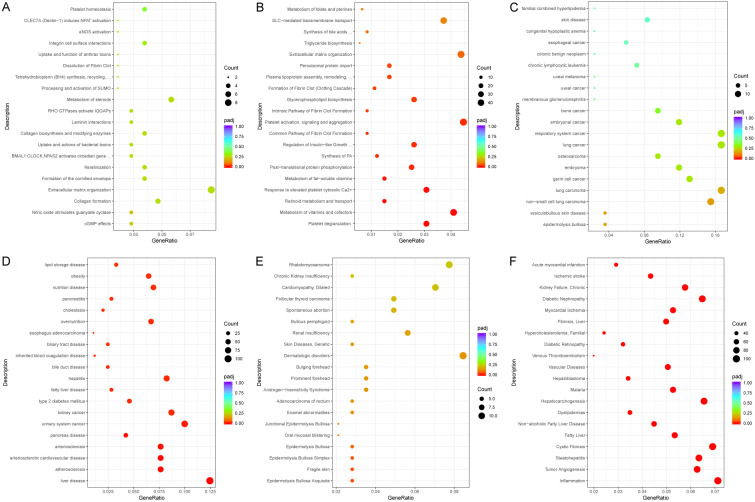
Figure 10.
Dot plots of enrichment analysis results for the reactome pathway, disease ontology and DisGeNET. A, B: Dot plots of enrichment analysis results for reactome pathways in HCCM and Huh7 cells. C, D: Dot plots of enrichment analysis results for disease ontology in HCCM and Huh7 cells. E, F: Dot plots of enrichment analysis results for DisGeNET in HCCM and Huh7 cells.

