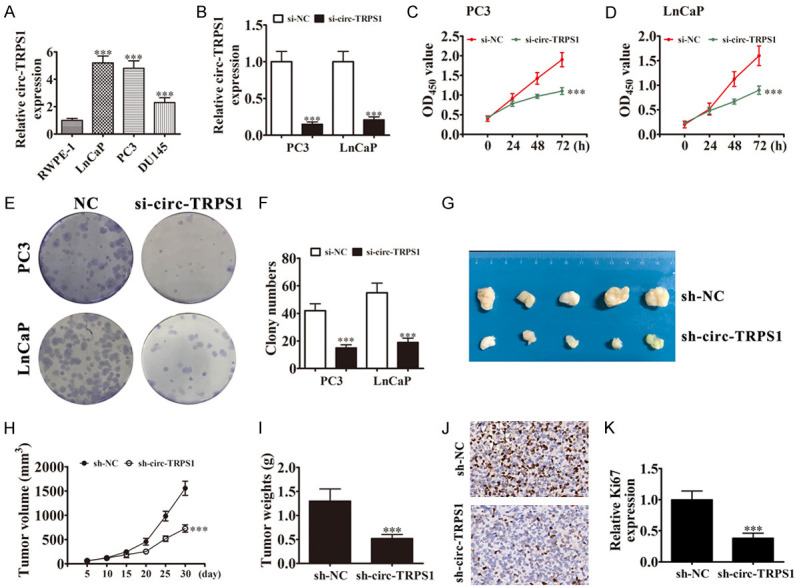
Figure 2.

Downregulation of circ-TRPS1 suppressed PCa proliferation in vitro and in vivo. (A) Expression of circ-TRPS1 in noncancer and cancer cell lines analyzed by RT-qPCR. Data are means ± SD; ***P < 0.001 vs. RWPE-1 group. (B) RT-qPCR detected circ-TRPS1 in PC3 and LnCaP after transfecting with negative control (NC) or siRNA against circ-TRPS1 (si-circ-TRPS1). Data are means ± SD; ***P < 0.001 vs. si-NC group. (C and D) CCK8 detection showed proliferation of PC3 and LnCaP cells. Data are means ± SD; ***P < 0.001 vs. si-NC. (E and F) Colony formation assays showing proliferation of PC3 and LnCaP cells. Data are means ± SD; ***P < 0.001 vs. si-NC. (G) PC3 cells transfected with NC or sh-circ-TRPS1 and subcutaneously injected into nude mice. (H) Tumor growth curves, (I) tumor weight. Data are means ± SD; ***P < 0.001 vs. sh-NC. (J and K) Immunohistochemistry for the percentage of Ki67-positive cells. The relative Ki67 expression was calculated. Data are means ± SD; ***P < 0.001 vs. sh-NC.
