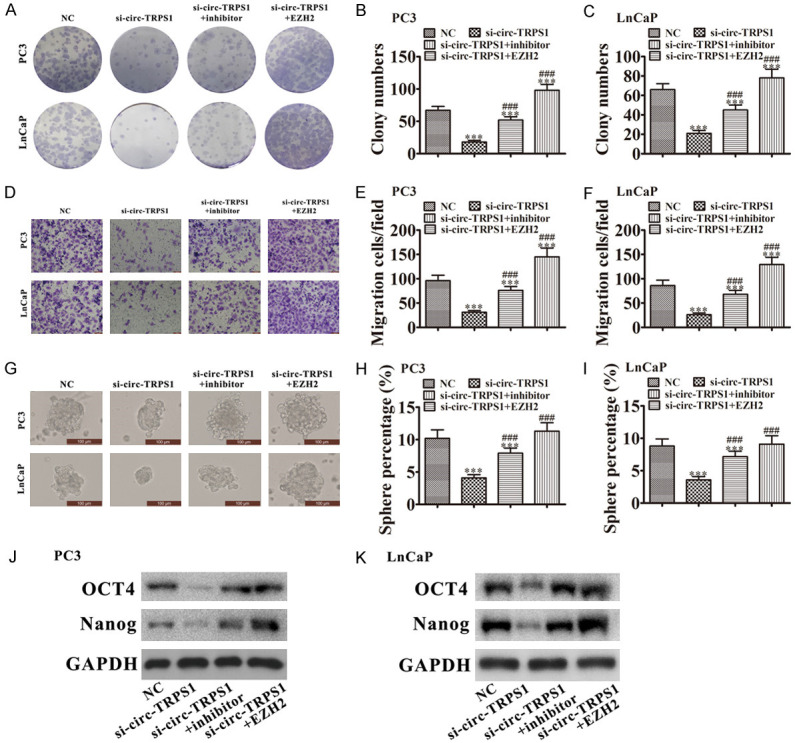
Figure 5.

Downregulation of miR-124-3p or overexpression of EZH2 reversed the inhibitory effect of si-circ-TRPS1 on PCa proliferation and migration. A-C. Colony formation assays showing the proliferation of PC3 and LnCaP cells. Data are means ± SD; ***P < 0.001 vs. NC. ###P < 0.001 vs. si-circ-TRPS1. D-F. Cell migration was assessed in PC3 and LnCaP cells using Transwell assays. Data are means ± SD; ***P < 0.001 vs. NC. ###P < 0.001 vs si-circ-TRPS1. G-I. Images of tumor sphere formation assays in PC3 and LnCaP cells (200 cells/well); scale bar, 100 μm. Data are means ± SD; ***P < 0.001 vs. NC. ###P < 0.001 vs. si-circ-TRPS1. J, K. Western blots for the expression of stemness markers OCT4 and Nanog in PC3 and LnCaP cells.
