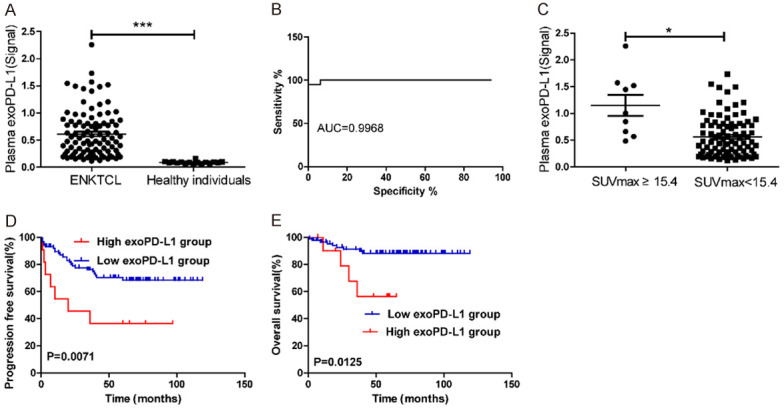
Figure 3.

(A) Plasma exoPD-L1 level measured by Simoa in 16 healthy subjects and 99 patients with ENKTL at diagnosis. (B) ROC analysis to evaluate the diagnostic power to detect ENKTL cases (n=99) from the healthy controls (n=16). (C) The exoPD-L1 level are significantly higher in patients with high SUVmax level (≥ 15.4) than those with lower SUVmax level at diagnosis. (D, E) Kaplan-Meier estimates of PFS (D) and OS (E) considering the cutoff point for exoPD-L1 at 1.2 (simoa signal).
