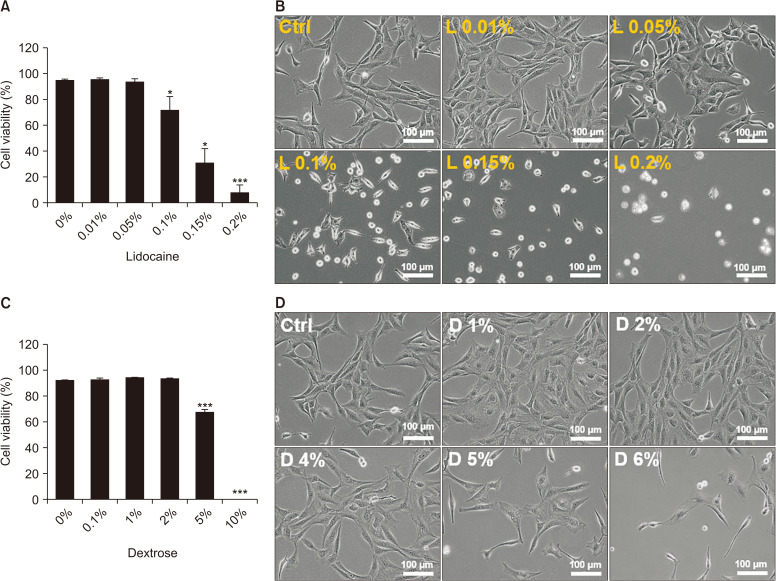
Fig. 1.
Trypan blue exclusion assay after treating the various concentrations of lidocaine and dextrose for 24 hours in NIH-3T3. Cell viability after treating various concentrations of lidocaine (A), and dextrose (C), and inverted microscopic images, respectively (B: lidocaine, D: dextrose). Medians and standard deviation, n = 8 for each group. Ctrl: control. *P < 0.05 and ***P < 0.001.

