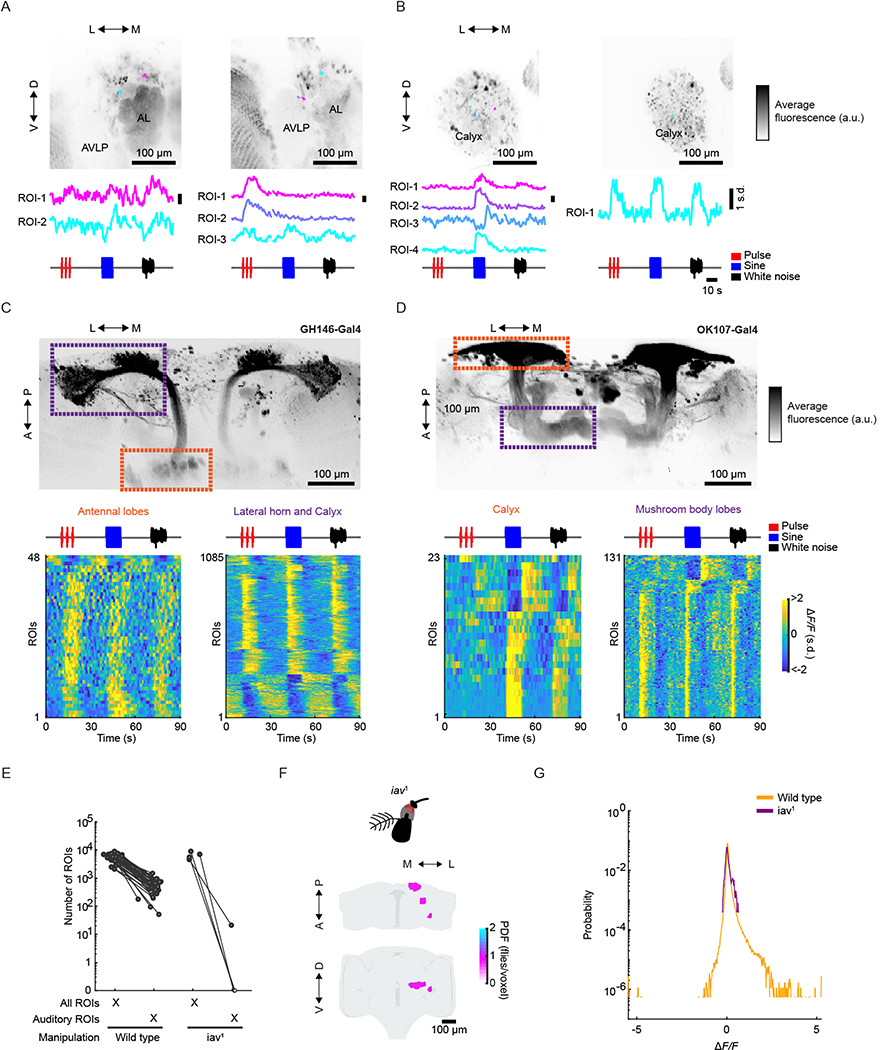
Extended Data Fig. 4 |. Auditory activity is present in olfactory pathway neurons and absent in deaf flies.
a,b, Auditory responses from (A) putative individual antennal lobe projection neurons (PNs), and (B) putative individual mushroom body Kenyon cells (KCs) from pan-neuronal recordings. Time-averaged GCaMP6s signal is shown in grayscale (over the entire experiment). Pixels belonging to individual ROIs and their corresponding time traces (median z-scored ΔF/F responses across 6 trials to pulse, sine, and white noise stimuli) are indicated in different colors. ROIs were drawn manually over the location of PN or KC somas from two independently imaged flies. Activity scale bar unit is s.d. c,d, Auditory responses from (C) antennal lobe projection neurons, and (D) mushroom body Kenyon cells using cell type specific genetic lines (GH146-Gal4 and OK107-Gal4, respectively). Time-averaged GCaMP6s signal is shown in grayscale (over the entire experiment) - the compartments where activity was recorded from are indicated (data was collected and processed as we did for pan-neuronal data (protocol a) in Extended Data Fig. 1a) but the field of view was restricted to the region defined by the orange and purple boxes). Auditory ROIs are detected in all imaged compartments of antennal lobe projection neurons (n = 8 flies, 1,133 ROIs) and Kenyon cells (n = 4 flies, 154 ROIs). Each row is the median across 6 trials - all responses are z-scored and therefore plotted as the change in the s.d. of the ΔF/F signal. e, Number of detected auditory ROIs per fly in wild type (n = 33 flies) and iav1 flies (n = 4 flies). f, Maximum projection (from two orthogonal views) of the density of auditory ROIs in iav1 flies (all 21 ROIs come from 1 out of 4 flies imaged). These few ROIs were located in the mushroom body calyx (MB-CA), posterior VLP (PVLP), and the posterior lateral protocerebrum (PLP). Color scale is the number of flies with an auditory ROI per voxel. g, Distribution of mean ΔF/F values (during stimuli) for auditory ROIs in wild type (n = 33 flies) and iav1 flies (n = 4 flies).

