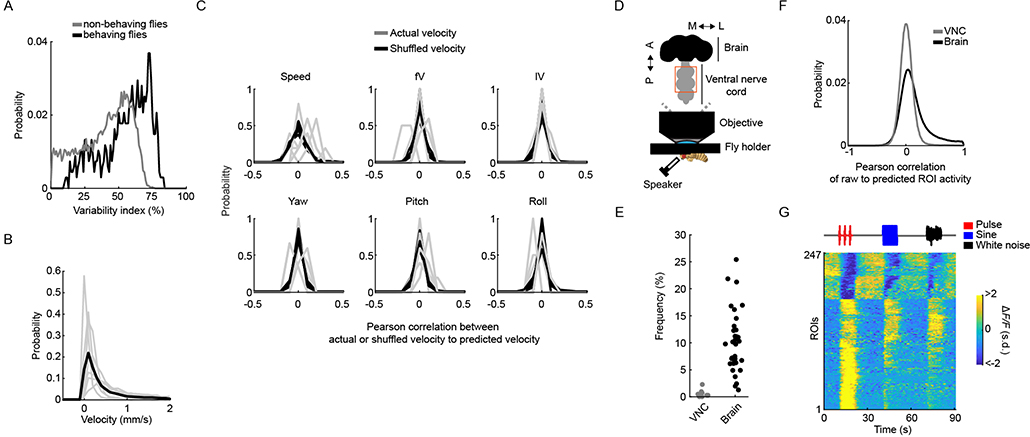
Extended Data Fig. 10 |. Behavior of head-fixed flies and minimal auditory responses in the Drosophila ventral nerve cord.
a, Distribution of across-trial variability of auditory ROIs in behaving (data used in Fig. 6, n = 7 flies, 4,560 ROIs) and non-behaving flies (data used in Fig. 5b, n = 33 flies, 19,036 ROIs). b, Distribution of speed across flies. Each gray line is the speed distribution per fly (n = 7 flies), and black line is the mean across animals. c, Correlation between linearly predicted velocities (based on stimuli history) and actual or shuffled (see Methods) velocities. Each black or gray line is the probability per fly (n = 7 flies). d, Schematic of VNC functional imaging during auditory stimulation. Similar to Fig. 1a, but the dorsal side of the thorax is dissected to expose the dorsal side of the first and second segment of the VNC depicted inside the orange rectangle. e, Frequency of auditory ROIs detected in the brain (n = 33 flies, 185,395 ROIs) and the VNC (n = 8 flies, 39,580 ROIs) using the same criteria as in Extended Data Fig. 1d. f, Distribution of Pearson correlation coefficients of raw ROI activity to predicted ROI activity (based on stimuli history, as in Extended Data Fig. 1e) for ROIs recorded from the brain (n = 33 flies, 185,395 ROIs) and the VNC (n = 8 flies, 39,580 ROIs). g, Responses of VNC auditory ROIs to pulse, sine, and white noise stimuli (n = 8 flies, 39,580 ROIs). Each row is the across-trial median and z-scored ΔF/F response to each stimulus (6 trials per stimulus). ΔF/F units are in s.d.

