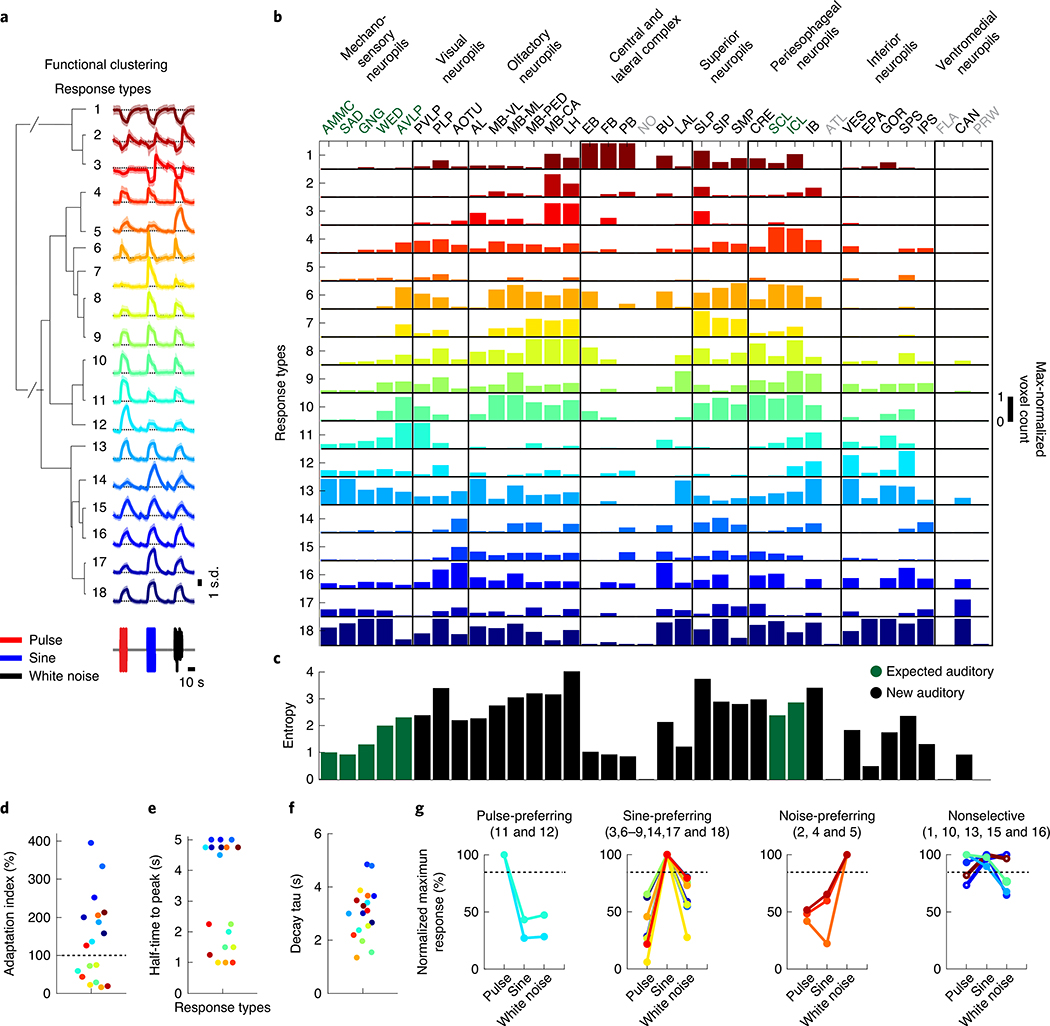
Fig. 3 |. Brain-wide auditory activity is characterized by a diversity of temporal response profiles across neuropils.
a, Hierarchical clustering of auditory responses into 18 distinct response types (Methods). Thick traces are the mean response (across ROIs) to pulse, sine and white noise, and shading is the s.d. (n = 33 flies, 19,036 ROIs). All responses are z-scored, and therefore plotted as the s.d. of the responses over time, with the black dash line corresponding to the mean baseline across stimuli for each response type. b, Distribution of 18 response types across 36 central brain neuropils. The histogram of voxel count (how many voxels per neuropil with auditory activity of a particular response type) was max-normalized for each neuropil (normalized per column). The color code is the same as in a (n = 33 flies). Neuropils with no auditory activity are indicated in gray font. c, The diversity (measured as the entropy across response-type distributions shown in b) of auditory responses across central brain neuropils (Methods). d–f, Kinetics of all auditory responses by response type. Adaptation (d), half-time to peak (e) and decay time tau (f). g, Diversity in tuning for response types showing pulse-preferring, sine-preferring, noise-preferring and nonselective response types (preference is defined by the stimulus that drives the maximum absolute response (at least 15% greater than the second highest response). Nonselective responses are divided into sine-and-pulse-preferring (filled circles) and sine-and-noise-preferring (open circles). See also Extended Data Figs. 5 and 6.

