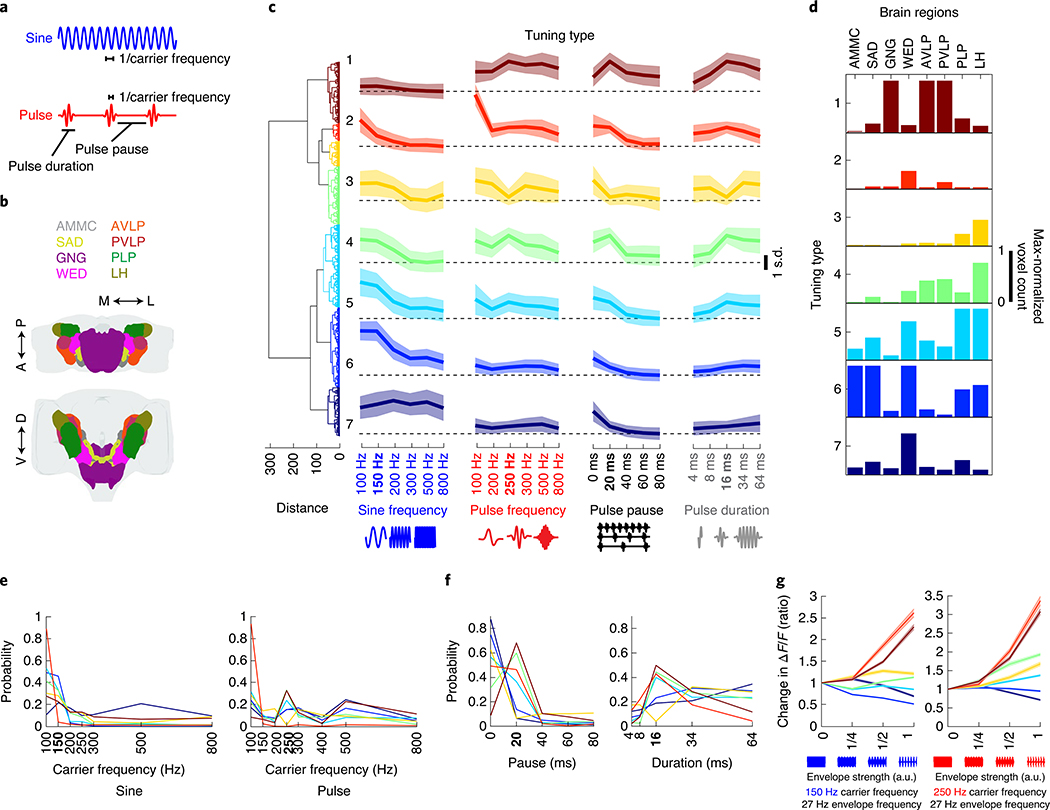
Fig. 4 |. Widespread auditory activity is tuned to features of conspecific courtship songs.
a, Spectral and temporal features of the two main modes of Drosophila courtship song. b, Neuropils imaged. c, Hierarchical clustering of auditory tuning curves (see Extended Data Fig. 7a for how tuning curves were generated) into seven distinct tuning types. Tuning types 1–7 comprise 1,783; 513; 739; 1,682; 2,410; 2,321 and 1,424 ROIs, respectively (n = 21 flies). Thick traces are the mean z-scored response magnitudes (80th or 20th percentile of activity—for excitatory or inhibitory responses—during stimuli plus 2 s after. Activity is plotted as the s.d. of ΔF/F values to the stimuli indicated on the x axis (across ROIs and within each tuning type) and shading is the s.d. (across ROIs within tuning type). D. melanogaster conspecific values of each courtship song feature are indicated in bold on the x axis (same for e and f). d, Distribution of tuning types across regions of selected brain neuropils imaged. The histogram of voxel count per type (number of voxels with activity that falls into each tuning type) was max-normalized for each neuropil (normalized per column). e, Probability distributions of best frequency for sine and pulse, separated by tuning type. The color code is the same as in c. f, Probability distributions of best pulse duration and pulse pause. Conventions are the same as in e. g, Effects of the amplitude envelope on responses to sine tones. Envelopes (~27-Hz envelope) of different amplitudes were added to sine tones (as depicted on the x axis; see Methods for more details) of 150 or 250 Hz. ROI response magnitudes to different envelope strengths were normalized to responses to envelope strength 0 (that is, a sine tone of 150 or 250 Hz, with no envelope modulation) and sorted by tuning type from c. Thick traces are the mean-normalized response magnitudes per tuning type, and shading is the s.e.m. (ROI number per tuning type is the same as in c). See also Extended Data Fig. 7.

