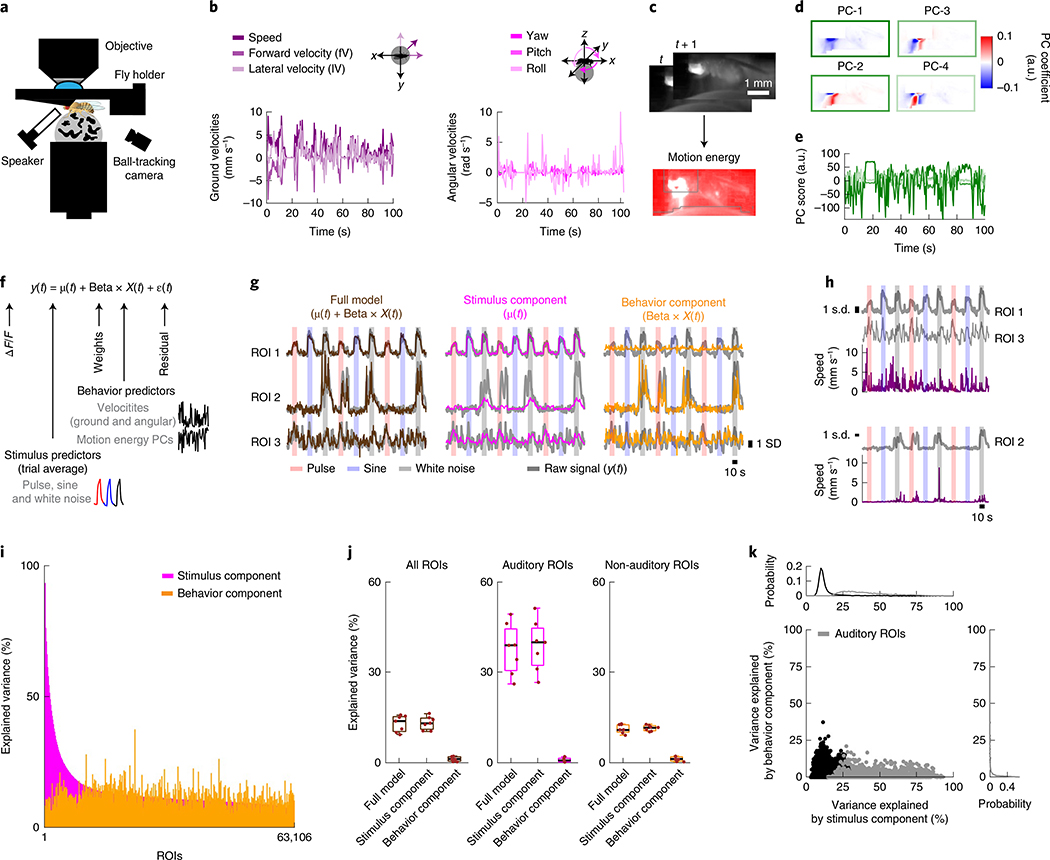
Fig. 6 |. Spontaneous movements do not account for trial-to-trial variability in auditory responses.
a, Schematic of the functional-imaging protocol of a head-fixed fly walking on a ball. b, Instantaneous ground and angular velocities measured from ball tracking of a representative tethered fly walking. c, Motion energy (absolute value of the difference of consecutive frames) from a video recording of tethered fly. Gray contours correspond to pixels excluded from analysis (Methods). d, Coefficients of the top four principal components (PCs) of the motion energy movie (image scale represents low-motion (blue) to high-motion energy (red)) of a representative tethered fly (same as b). e, Scores of the top four PCs of the motion energy movie (the color of each PC is the same as in box color in d) of a representative tethered fly (same as b). f, Schematic of the linear model used to predict neural activity related to either stimuli or behavior. ROI activity (y(t)) is modeled as the sum of the stimulus component (trial average, μ(t)), behavior component (Beta × X(t)), plus noise (ε(t)). g, ROI activity along with predictions by stimulus component (μ(t)), behavior component (Beta × X(t)) or the full model for three example ROIs most strongly modulated by auditory stimuli (ROI 1), by behavior (ROI 2) or by the combination of both (ROI 3). The ROI activity values were z-scored, and ΔF/F units are in s.d. (also for h). h, Activity of ROIs from g along with speed. ROIs from the same fly are plotted together. i, Explained variance by stimulus component or behavior component for individual ROIs, sorted by stimuli-only model performance (n = 7 flies, 63,106 ROIs). j, Mean explained variance by stimulus component (μ(t)), behavior component (Beta × X(t)) or both (μ(t) + Beta × X(t)) across flies, for all ROIs (left), auditory ROIs only (middle) and non-auditory ROIs (right). The box shows the 25th and 75th percentile, the inner black line is the median explained variance across flies, and whiskers correspond to minimum and maximum values. Means per fly are plotted with brown dots (n = 7 flies). k, Explained variance by stimulus component versus behavior component for individual ROIs. Gray dots correspond to auditory ROIs (using the same criteria as in Extended Data Fig. 1d). See also Extended Data Fig. 10.

