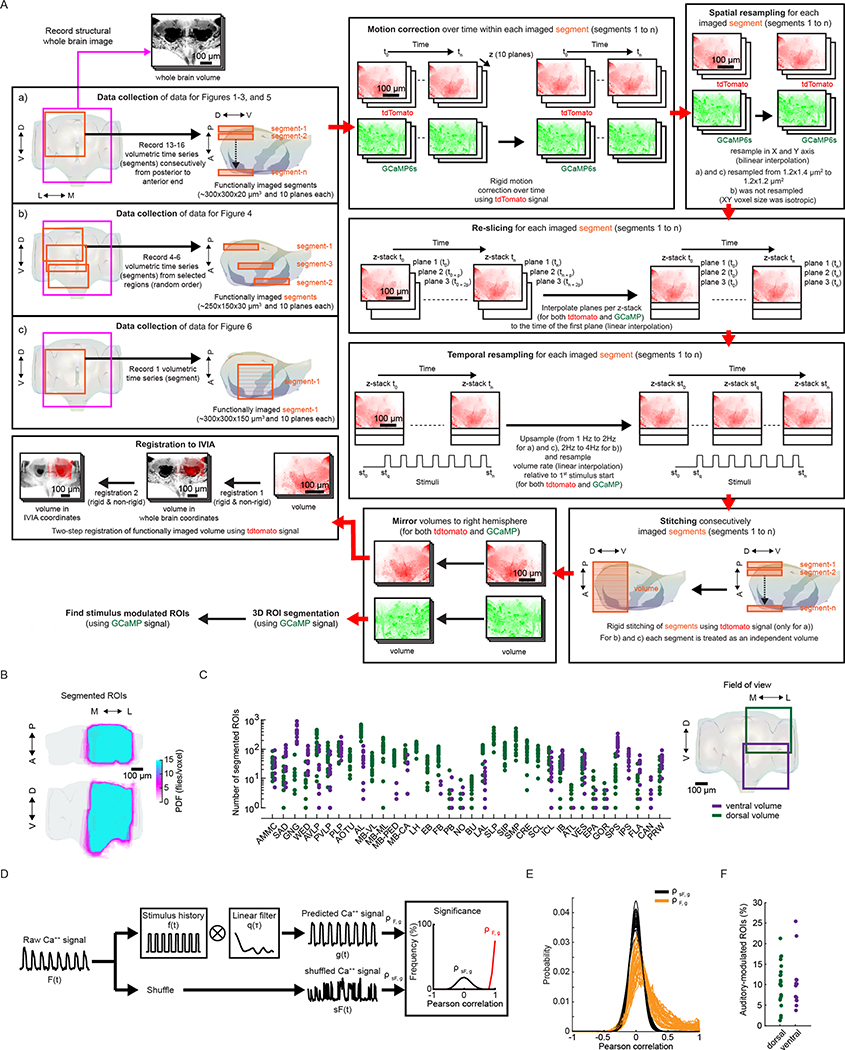
Extended Data Fig. 1 |. Spatial coverage of imaged activity and measurement of auditory-evoked activity.
a, Data collection and processing. We collected data using the following protocols: a) short volumetric recordings (~10 min) of consecutive segments (from anterior to posterior axis), b) long volumetric recordings (~30 min) of selected brain areas (non-consecutive), and c) short and coarse volumetric recording (~15 min) of a single segment per fly that spans a large volume. For all these datasets we record a private whole brain structural volume (used later for registration). For all the data sets we recorded both tdTomato and GCaMP signal, and performed motion correction (using NoRMCorre) on each imaged segment using the tdTomato signal. These segments were then spatially resampled to have isotropic XY pixel size. This was followed by re-slicing of each Z-stack per segment (align time of all planes per Z-stack to the first plane imaged), and temporal resampling (aling Z-stack time relative to the start of the 1st stimulus and double the sampling rate). For protocol a), we stitched segments imaged consecutively (using NoRMCorre) obtaining a ‘volume’; for b) and c) each segment was treated as an independent volume. Volumes were mirrored to the right hemisphere, and the tdtomato signal was used for registration to the in vivo intersex atlas (IVIA). This is a two-step process, i) volumes per fly were registered to their own private whole brain volume (one per fly), and ii) whole brain volume was registered to the IVIA; registration i) and ii) were concatenated to map volumes to IVIA space. The GCaMP signal was used for ROI segmentation (via CaImAn), followed by identification of stimulus-modulated ROIs (see Extended Data Fig. 1d). b, Maximum projection (in each dimension) of segmented ROIs from all imaged volumes (n = 33 flies, 185,395 ROIs) - ROIs from the left hemisphere are mirrored (see Extended Data Fig. 1a) such that all ROIs are projected onto right hemisphere. ROIs cover the entirety of the D-V and A-P axes. Color scale indicates the number of flies with an ROI in each voxel. c, Number of ROIs across neuropils (see Fig. 1f,g and Supplementary Movies 1–4) sampled by ventral volumes or dorsal volumes (n = 33 flies, 185,395 ROIs). d, Method for identifying stimulus-modulated ROIs. Raw Ca++ signal (F(t)) is convolved with the stimulus history (f(t)) and a set of filters per stimulus type (q(τ)) to generate the predicted Ca+ + signal. Auditory modulation is measured by the cross-validated correlation scores (⍴F,g) between raw and predicted Ca++ signals. Correlation of shuffled Ca++ signal (sF(t)) to predicted signal (g(t)) is used to generate the null-distribution of correlation scores (⍴sF,g), which is used to determine significance. e, Distribution of Pearson correlation coefficients of shuffled-vs-predicted signals (⍴sF,g) and raw-vs-predicted signal (⍴F,g) across all flies imaged (n = 33 flies). Unlike the distribution of ⍴sF,g, ⍴F,g has a distribution with a long tail of positive correlation scores. ROIs within the positive tail and outside the null distribution are considered to have significant stimuli modulation and selected as auditory ROIs. f, Frequency of auditory ROIs separated by whether the ROI was segmented from a dorsal or ventral volume (n = 33 flies).

