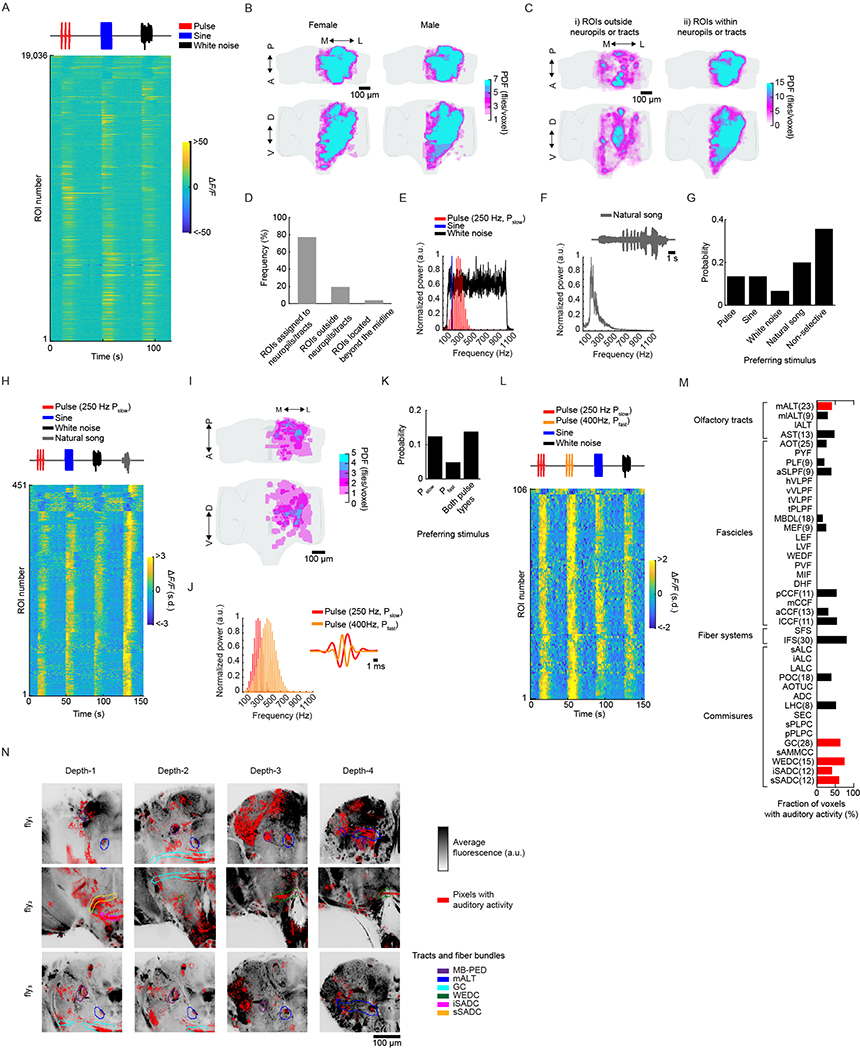
Extended Data Fig. 3 |. Auditory responses in neuropils and neurite tracts, and to additional song stimuli: natural song and fast pulses.
a, Median ROI responses (across 6 trials) to pulse, sine, and white noise stimuli (n = 33 flies, 19,036 ROIs) as in Fig. 2a, but without z-scoring ΔF/F signal. b, Spatial distribution of auditory activity across sexes. Maximum projections (from two orthogonal views) of the density of auditory ROIs in female (n = 17) or male flies (n = 16). c, Maximum projection (from two orthogonal views) of the density of i) auditory ROIs outside neuropils or neurite tracts (n = 33 flies, 4,346 ROIs), and ii) auditory ROIs within neuropils or neurite tracts (n = 33 flies, 14,658 ROIs). Color scale for (B) and (C) is the number of flies with an auditory ROI per voxel. d, Percentage of auditory ROIs within and outside neuropils and tracts, and beyond the midline. e, Spectral profile of auditory stimuli - pulse (Pslow), sine, and white noise - used to classify response types in Fig. 3a, and their spectral features. f, Spectral profile of natural song stimulus used. g, Distribution of stimuli preference (to pulse, sine, white noise, and natural song) across auditory ROIs (n = 5 flies, 2,258 ROIs). Only ~20% of auditory ROIs prefer natural song. Preference is defined by the stimulus that drives the maximum absolute response (at least 15% greater than the second highest response), as in Fig. 3f. h, Responses from auditory ROIs that prefer natural song (n = 451 ROIs). Each row is the median z-scored ΔF/F response across 6 across trials. Activity is plotted as the change in the s.d. of the ΔF/F signal. i, Spatial distribution of natural song preferring ROIs. Images are the maximum projection (from two orthogonal views) of the density of auditory ROIs with preference for natural song throughout the central brain (n = 5, 451 ROIs). j, Spectral profile of Pfast and Pslow stimuli. k, Distribution of stimuli preference to Pslow, Pfast, or broad preference for both pulse types across auditory ROIs (n = 2 flies, 2,193 ROIs). Only ~4% of auditory ROIs prefer Pfast. Preference is defined as in (G). l, Responses from auditory ROIs that prefer Pfast (n = 106 ROIs). Pfast preferring ROIs also show strong responses to Pslow. Conventions same as in (H). m, Fraction of voxels with auditory activity by central brain neurite tracts; percentages averaged across 33 flies (a minimum of 4 flies with auditory activity in a given tract was required for inclusion). Red represents tracts that were clearly distinguishable from neuropil by visual inspection (see (N)). n, For three flies, pixels with auditory activity (red) overlaid on time-averaged GCaMP6 fluorescence (grayscale). Several neurite tracts are indicated (planes from different depths are arbitrarily selected for each fly to highlight ROIs contained within neurite tracts).

