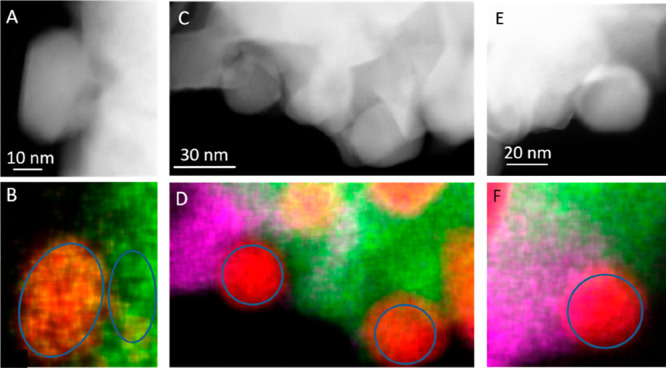
Figure 5.

Panel A and B: HAADF image and EDX analysis of spent La2Ni0.9Cu0.1O4 (Ni–K (red), Cu–K (yellow), and La-L (green) after one DRM cycle (CO2:CH4:He = 1:1:3) in a total gas flow of 100 mL min–1 up to 800 °C for a total time of 2 h. Panels C/D and E/F show HAADF images and EDX maps of different spots on spent La1.8Ba0.2Ni0.9Cu0.1O4. (Ni–K (red), Cu–K (yellow), La–L (green), and Ba–L (magenta)). The areas that have been used for quantitative analysis are encircled.
