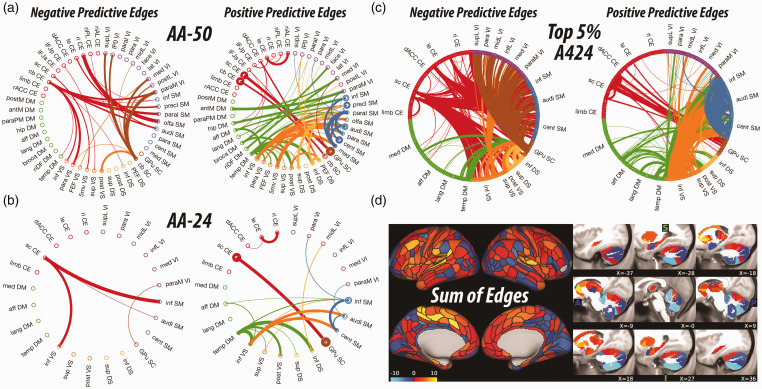
Figure 1.
Pretreatment connectome fingerprint (CFP). A–C, The circular graphs are labeled based on the Akiki-Abdallah (AA) whole-brain architecture at 50 modules (AA-50; primary CFP), 24 modules (AA-24), and the full connectome with 424 nodes (A424). Modules and nodes are colored according to their affiliation to the 7 canonical connectivity networks: central executive (CE), default mode (DM), ventral salience (VS), dorsal salience (DS), subcortical (SC), sensorimotor (SM), and visual (VI). Edges are colored based on the initiating module using a counter-clockwise path starting at 12 o’clock. Internal edges (i.e., within module) are depicted as outer circles around the corresponding module. Thickness of edges reflect their corresponding weight in the predictive model. The module abbreviations of AA-24 and AA-50, along with further details about the affiliation of each node are available at https://github.com/emergelab/hierarchical-brain-networks/blob/master/brainmaps/AA-AAc_main_maps.csv. Only edges of significant predictive models following correction are shown in A and C (all p ≤ 0.05). The model in B was at trend level (p = 0.08). C, For the full connectome, it is not possible to visually discern the underlying signature considering the large number of edges retained. Therefore, as in previous studies, the circular graph is thresholded using nodal strength within the full connectome fingerprint as cutoff to retain the highest top 2.5% negative predictive edges and top 2.5% positive predictive edges. D, Shows the nodal degree of the full connectome fingerprint edges without a threshold. The color bar unit is arbitrary, reflecting the sum of weighted edges. All predictive models will be made publicly available at https://github.com/emergelab.

