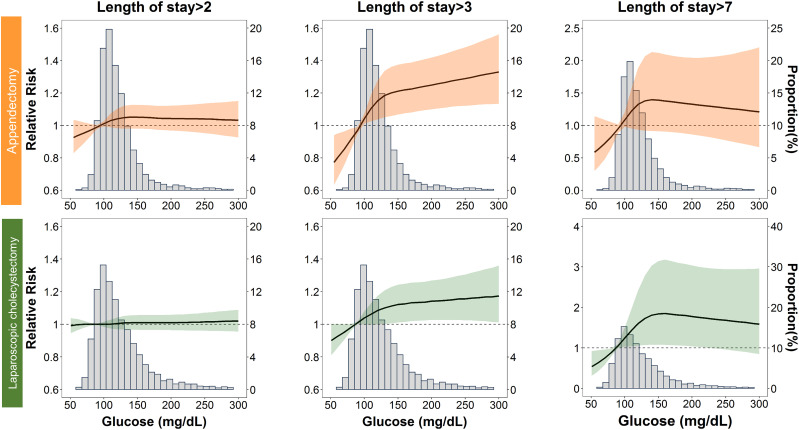
Figure 1.
Relative risk for a hospital stay longer than 2, 3, and 7 days according to POBG level. The solid black lines represent aRRs based on restricted cubic splines for POBG level with knots at the 10th, 50th, and 90th percentiles (appendectomy: 94, 113, and 153 mg/dL; laparoscopic cholecystectomy: 87, 114, and 175 mg/dL, respectively). The shaded areas represent upper and lower 95% CIs. The reference was set at the 10th percentile of POBG levels. Adjustment factors are the same as those in model 4 of Table 2.

