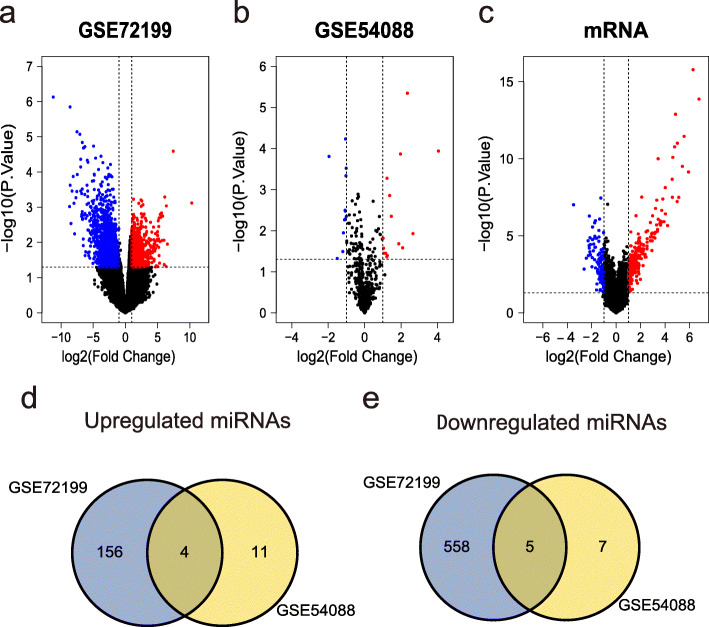
Fig. 2.
Volcano plots of a DEMs in GSE72199, b DEMs in GSE54088, and c DEGs in GSE81582 (GPL15207). The red color represents the upregulated genes between primary CRC tumors and liver metastases, while the blue color represents the downregulated genes, and the black indicates no significant difference. The Venn diagram shows the common d upregulated DEMs and e downregulated DEMs between GSE72199 and GSE54088. Blue represents the number of DEMs in GSE72199, yellow represents the number of DEMs in GSE54088, and the intersecting part represents the DEMs common to both data sets

