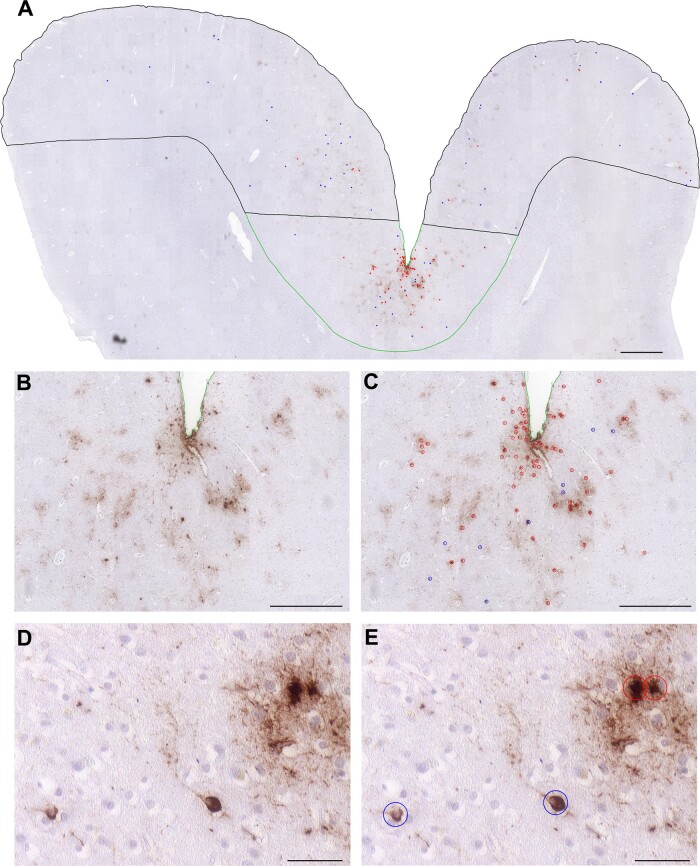
Figure 1.
Neuronal and astroglial tau pathologies of CTE neuropathologic change. (A) Low power view of cortical material from a former American football player who died in his 70s with a diagnosis of dementia with Lewy bodies (Case C5) reveals a patchy distribution of p-tau-immunoreactive (CP13) profiles, with apparent concentration of pathology to the sulcal depth (outlined in green) compared to the gyral crest (outlined in black). (B, C) There is clustering of p-tau immunoreactive profiles around cortical vessels, (D, E) which on higher power are revealed as typical neurofibrillary tangles (blue circles) and thorn-shaped astrocytes (red circles). Scale bars: (A) 1 mm, (B, C) 500 μm and (D, E) 50 μm

