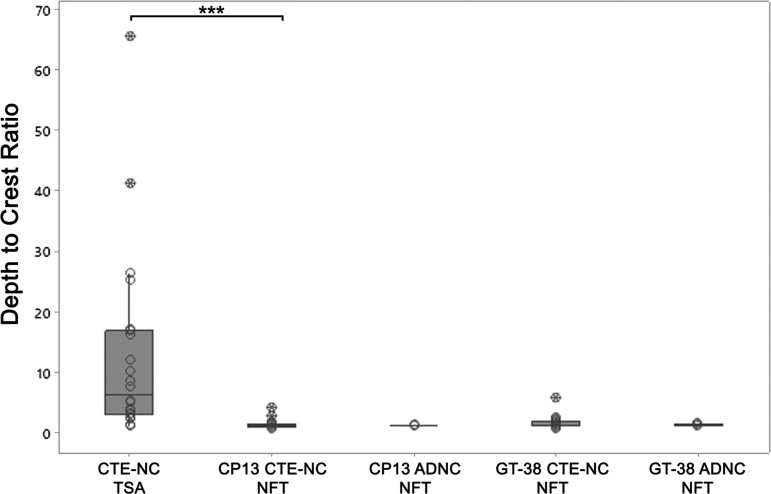
Figure 4.
Depth to crest ratio of tau pathologies in CTE-NC and ADNC. Quantitative assessment of thorn-shaped astrocytes and neuronal profiles in each case reveals astrocytes with a higher ratio of sulcal depth to gyral crest density (sulcal depth to gyral crest ratio 12.84 ± 15.47; mean ± SD) than co-existing neurofibrillary tangles (1.40 ± 0.74; P < 0.001). There was mild concentration of both CP13- and GT-38-immunoreactive neurofibrillary tangles in CTE-NC, which was similar to that seen in material from patients with ADNC (all analyses not significant). TSA, thorn-shaped astrocytes; NFT, neurofibrillary tangles; open circles, individual data points; crossed circles, outliers

