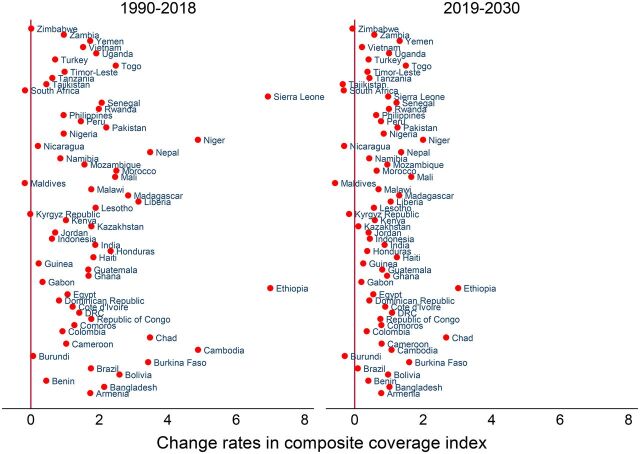
FIGURE 5.
Average Annual Rate of Changea in Composite Coverage Index in Low- and Middle-Income Countries
a Annual rate of change is calculated as: ln[(rate in latest year/rate in earliest year)]/(latest year − earliest year), with positive values located on the right side of the diagonal line at 0 (in X-axis) denoting an increasing rate, while negative values located on the left side of the diagonal line at 0 (in X-axis) denoting a decreasing rate.

