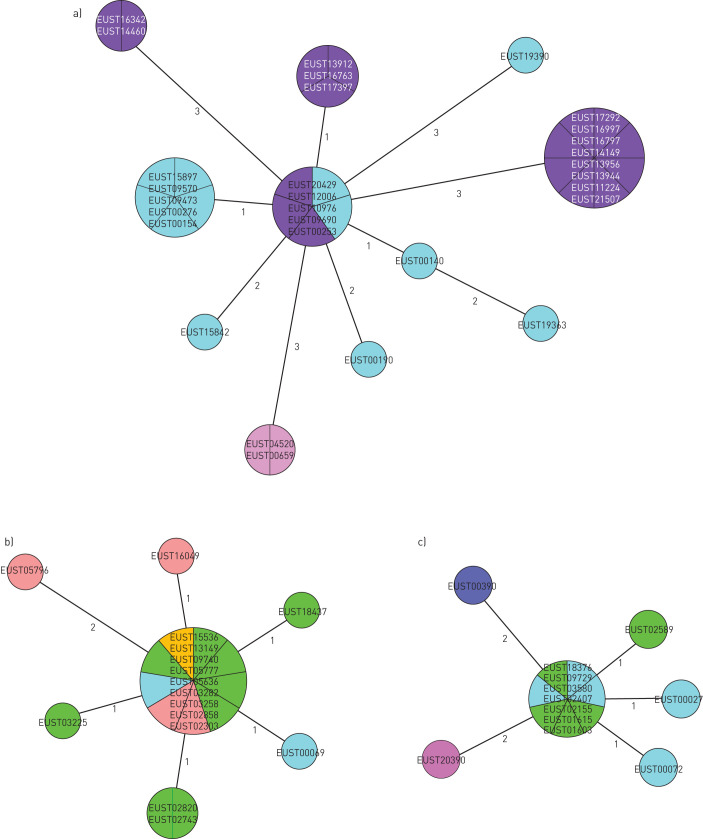
FIGURE 4.
Minimum spanning tree of a) snpCL1, b) snpCL3 and c) snpCL8. The numbers on the branches indicate the genetic distance in single nucleotide polymorphism (SNP) differences to the nearest isolate. SNP differences between distant isolates can be reconstituted by summing the number of SNPs on the branches. Different colours indicate the different European Union/European Economic Area countries where the strains were isolated.

