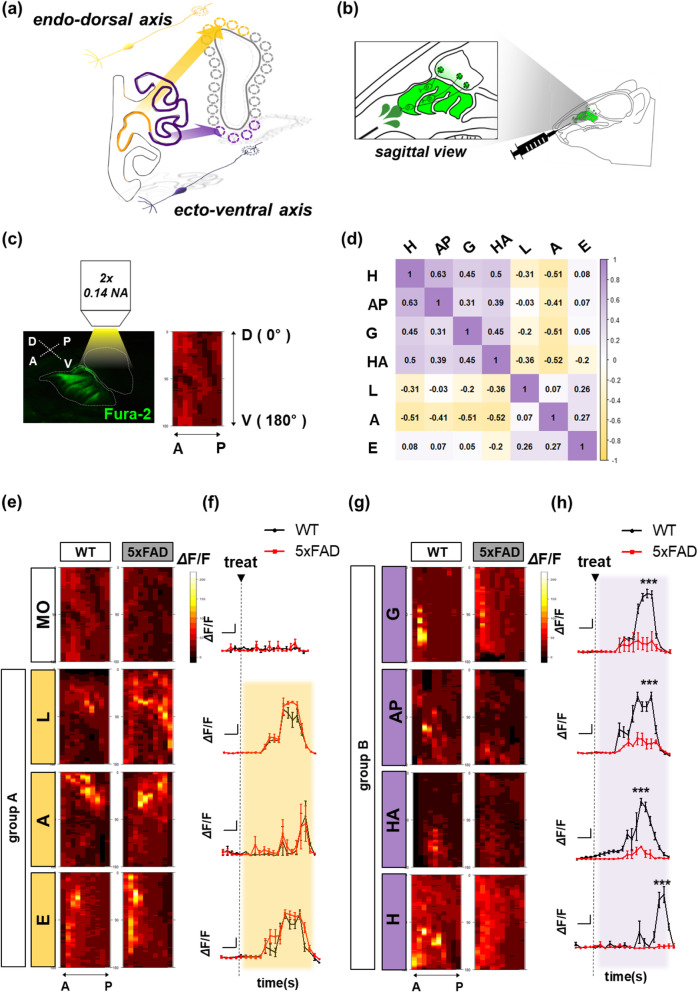
Fig. 2.
Odor-derived Ca2+ signal in peripheral olfactory glomeruli is divided into two groups. a Illustration of the topographical axis. b Illustration of wide-field fluorescence imaging to measure OSN-derived input signal. c The imaging location with high-resolution stereoscopic fluorescence image of fura-2 by OSN calcium concentration (left) and averaged activity sample map along histologic angle (D; dorsal, V; ventral, A; anterior, P; posterior) (right). d Heat map clustering showing the Spearman’s correlation coefficient between each active calcium signal pattern with the angle of glomeruli located. (WT, n = 5–6). Each odorant was divided into two groups; lyral [L], acetophenone [A], and eugenol [E] (group A), and geraniol [G], allyl phenylacetate [AP], heptanoic acid [HA], and heptanal [H] (group B). e, g The merged intensity (cumulated signal) (f, h) of olfactory synaptic activity (ΔF/F) induced by each group odorant (WT, n = 5–6; 5xFAD, n = 5–6). e–f Odor-group A. g–h Odor-group B. ΔF/F represented as mean ± SEM from five independent experiments. For statistical analysis, an unpaired t test was performed using Prism software (GraphPad software). Statistical significances are noted (***P < 0.001). Olfactory sensory neurons (OSNs), wild-type (WT), five familial AD mutations (5xFAD), Alzheimer’s disease (AD)

