Fig. 3.

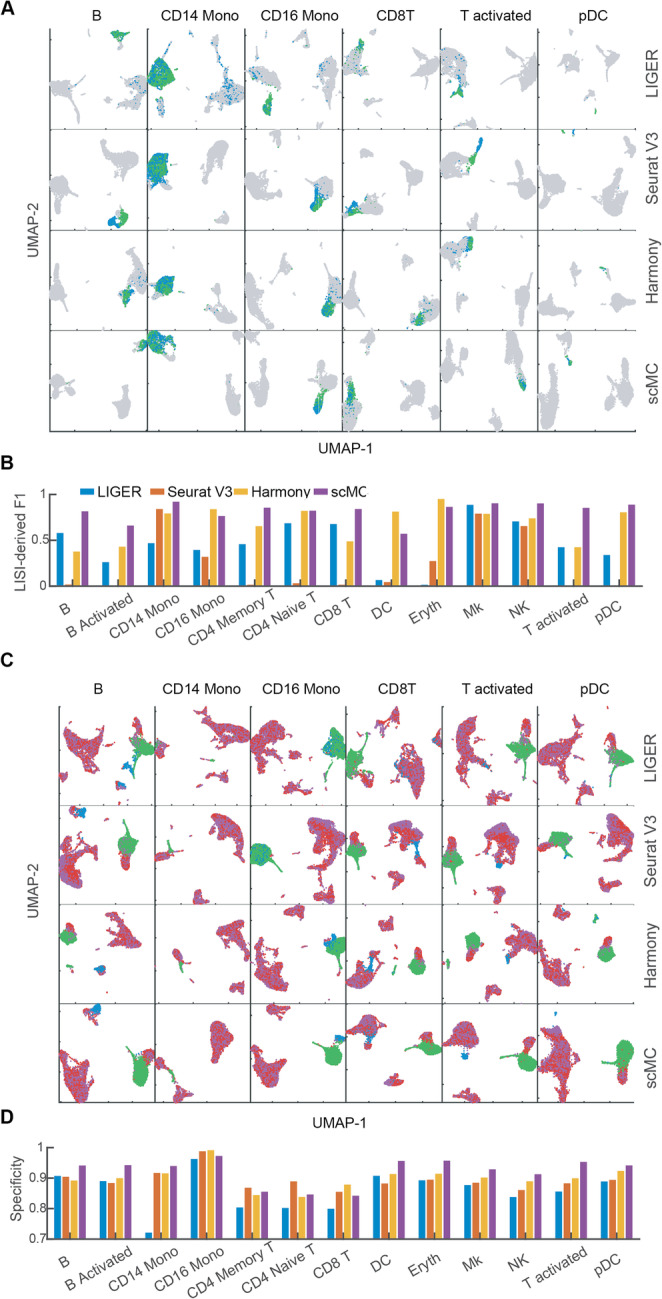
scMC aligns and preserves condition-specific cell subpopulations on perturbed PBMC datasets. a UMAP of the corrected data from LIGER, Seurat V3, Harmony, and scMC across control and stimulated conditions in the perturbed PBMC datasets. Each row represents one method, and each column represents one perturbed dataset in which only one cell subpopulation was retained in the control condition (indicated on the top). See Additional file 2: Figure S3A for other 7 perturbed datasets. Green: cells retained in the control condition; blue: cells from the corresponding same cell subpopulation in the stimulated condition; gray: other cells in the stimulated condition. b LISI-derived F1 scores of LIGER, Seurat V3, Harmony, and scMC on all 13 perturbed datasets. c UMAP of the corrected data from LIGER, Seurat V3, Harmony, and scMC across control and stimulated conditions. Each column represents one perturbed dataset, where the cell subpopulation removed in the control condition is labeled on the top, and CD14 Mono and DC cell subpopulations were also removed in the stimulated condition for all cases. See Additional file 2: Figure S3B for other 7 perturbed datasets. Green: CD14 Mono and DC cells from the control condition. Red: other cells from the control condition. Blue: cells of the cell subpopulation removed from the control condition in the stimulated condition. Purple: other cells in the stimulated condition. d Specificity scores of LIGER, Seurat V3, Harmony, and scMC on all 13 perturbed datasets
