
Fig. 7.
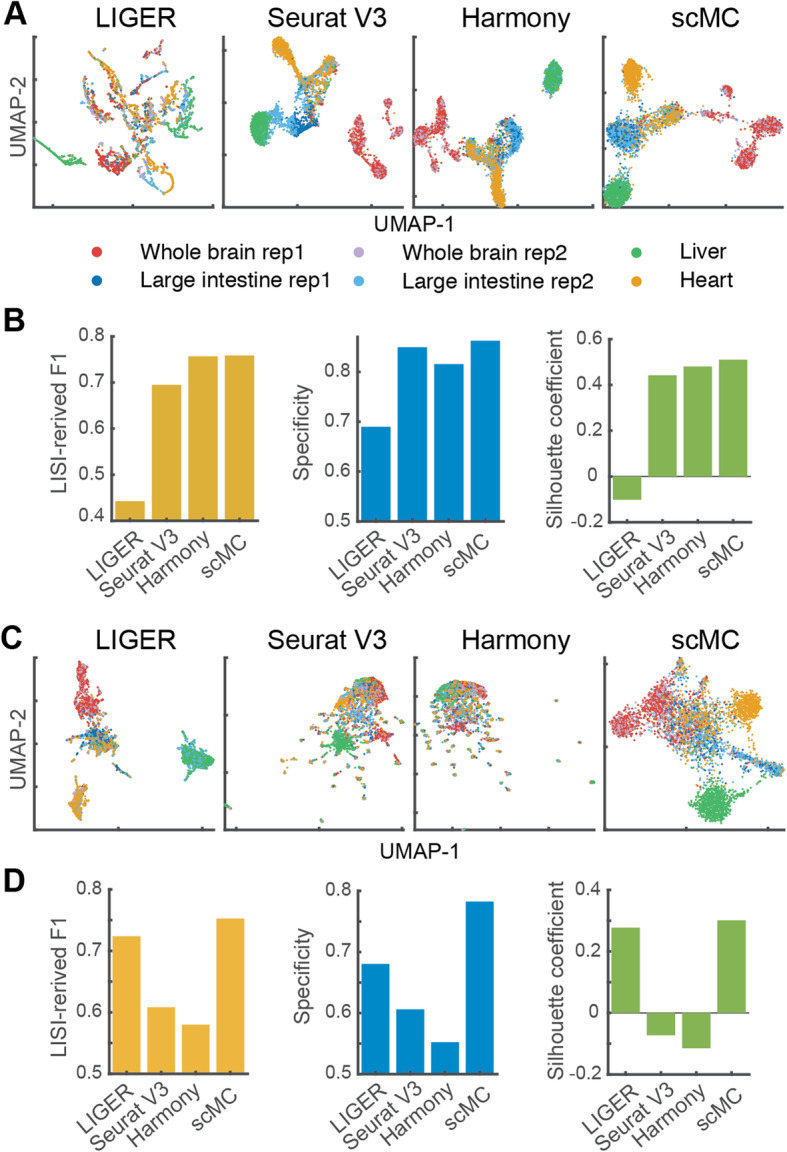
scMC performs well in integrating scATAC-seq datasets. a UMAP of the corrected data from LIGER, Seurat V3, Harmony, and scMC on an scATAC-seq dataset with the feature matrix transformed by ChromVAR. Cells are colored by known tissue origins. b Quantitative evaluation of removing batch effects, preserving condition-specific tissues, and separating different tissues on the aligned UMAP space from four methods using LISI-derived F1, specificity, and silhouette metrics. The feature matrix was constructed using ChromVAR. c, d The four integration methods applied to the feature matrix transformed by Gene Scoring