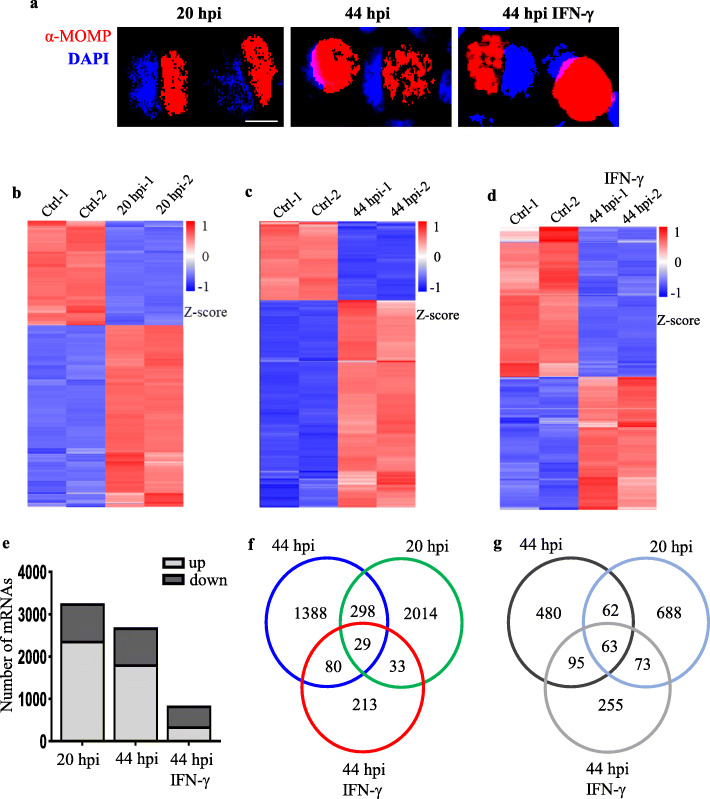
Fig. 1.
Genome-wide analysis of mRNAs at different stages of C. trachomatis infection. a Microscopic images of C. trachomatis infected cells at 20 hpi, 44 hpi, and IFN-γ treatment at 44 hpi. Red: anti-MOMP antibody, blue: DAPI. Fluorescence microscopy was carried out using Leica DM IL LED microscope (Wetzlar, Germany) and processed with Image J (https://imagej.nih.gov/ij/). Scale bar indicates 10 μm. b-d Heatmap plots showing differentially expressed host cell mRNAs at 20 hpi, 44 hpi, and 44 hpi with IFN-γ treatment as compared to their respective negative controls. Cutoff value > 1 reads and P-value < 0.05. Heatmaps were created with R version 3.6.3 (https://www.r-project.org/). e The number of host cell DEGs at 20 hpi, 44 hpi, and 44 hpi with IFN-γ treatment. f Venn diagram of upregulated mRNAs at 20 hpi, 44 hpi, and 44 hpi with IFN-γ treatment. g Venn diagram downregulated mRNAs in C. trachomatis-infected host cells. The differentially expressed genes are defined as those with fold change ≥2 (upregulated) or ≤ 0.5 (downregulated) between the groups and their respective controls with an adjusted P-value < 0.05. Data are the average expression from two independent experiments

