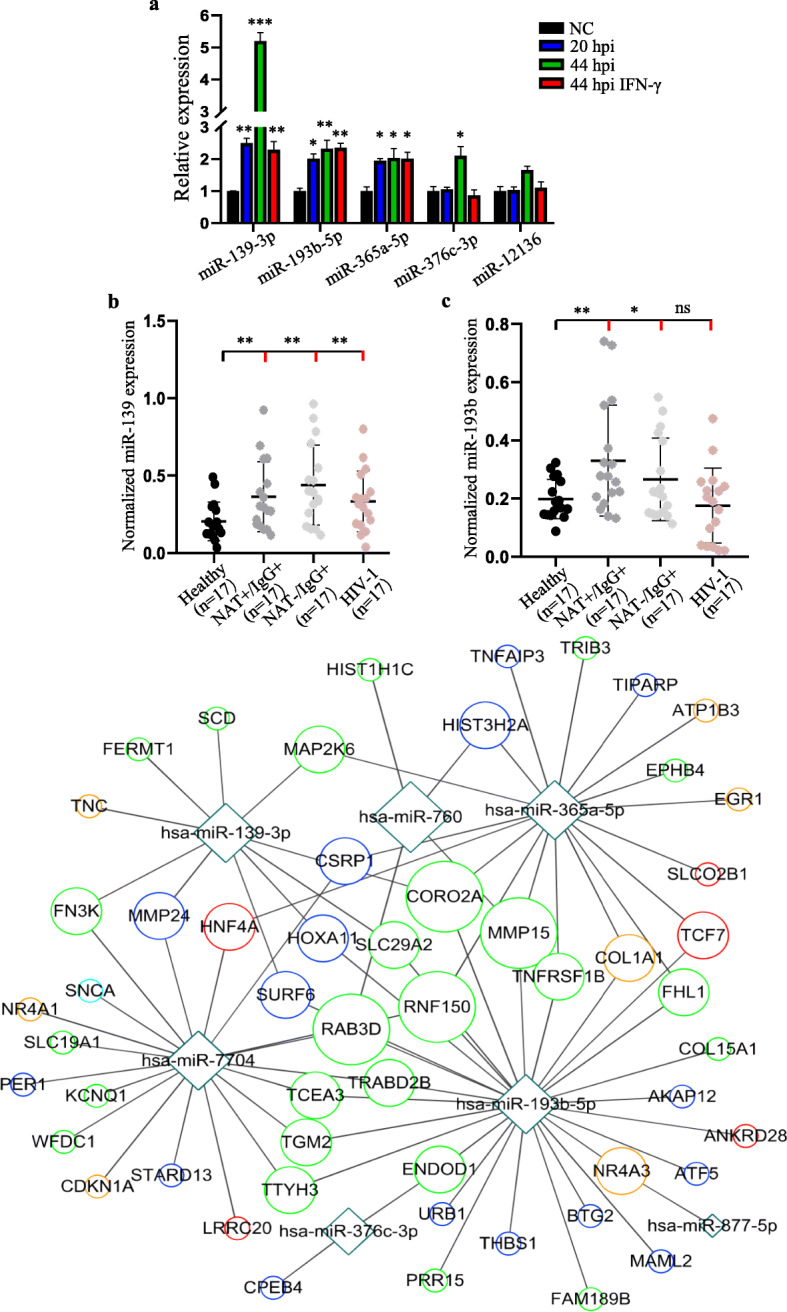
Fig. 5.

Analysis of commonly expressed miRNAs post-C. trachomatis infection. a Relative expression levels of the top 5 miRNAs that were commonly expressed at all stages of C. trachomatis infection. Normalized expression levels of miR-139-3p (b) and miR-193b-5p (c) in serum samples from C. trachomatis patients, HIV-1 patients, and healthy controls. NAT+/Ab+ indicates positive for nucleic acid and C. trachomatis antibody. NAT−/Ab+ indicates negative for nucleic acid, but positive for C. trachomatis antibody. All serum samples were recovered from − 80 °C after almost a year of storage. Data are mean ± SEM of three replicates for each serum sample (n = 17). Relative expressions were calculated using the delta-delta Ct method after normalization with the expression levels of GAPDH in each sample. Student’s t-test, * P < 0.05, ** P < 0.01, *** P < 0.001 by comparing healthy samples (black) with C. trachomatis or HIV-1-infected serum samples (red). Images (a, b, c) were created and analyzed with GraphPad Prism 8 (https://www.graphpad.com/scientific-software/prism/). d mRNA-miRNA interaction network between the top 5 commonly upregulated miRNAs 20 hpi, 44, and 44 hpi with IFN-γ treatment and their potential targets. The potential miRNA target genes were predicted with TargetScanHuman7.2 software (http://www.targetscan.org/vert_72/). The network was drawn with Cytoscape version 3.0.1 (http://www.cytoscape.org/). Circles indicate the target host genes whereas the squares indicate the miRNAs. The size of the circle represents the degree of the node adjusted according to the number of targeted miRNAs. The color of the circles represents the stage of C. trachomatis infection: green, 20 hpi; blue, 44 hpi; red, 44 hpi with IFN-γ treatment; orange, both 20 hpi and 44 hpi with IFN-γ; light blue, 44 hpi with or without IFN-γ
