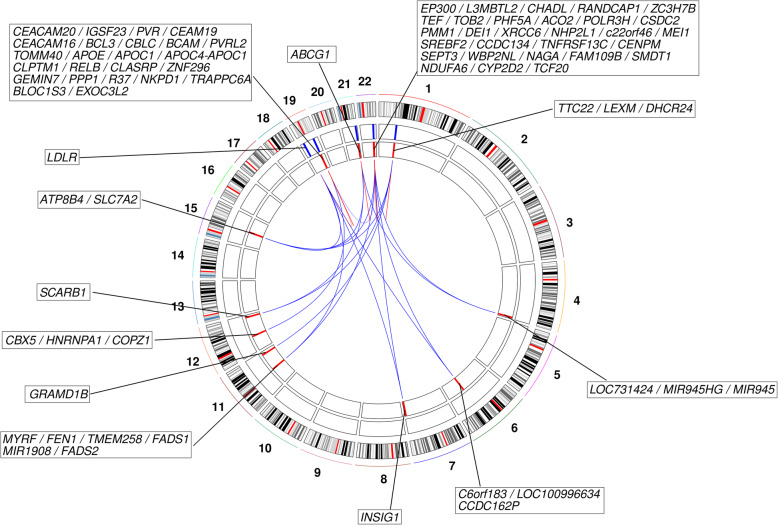
Fig. 3.
Circular plot indicating the locations of APOE ε4 vs. ε2 carrier-associated DMP and DMR CpGs. The first track shows a chromosome ideogram (hg19/GRCh37). The genomic locations of CpGs identified as being DMPs or in DMRs identified in APOE ε4 vs. ε2 carriers are indicated by blue lines on the second track and the meQTLs associated with these CpGs are indicated by the red lines on the third track. The connections between CpGs and meQTLs indicate regulatory relationships (cis interactions in red; trans interactions in blue). Gene symbols for genes located in each CpG/meQTL-harbouring region are indicated

