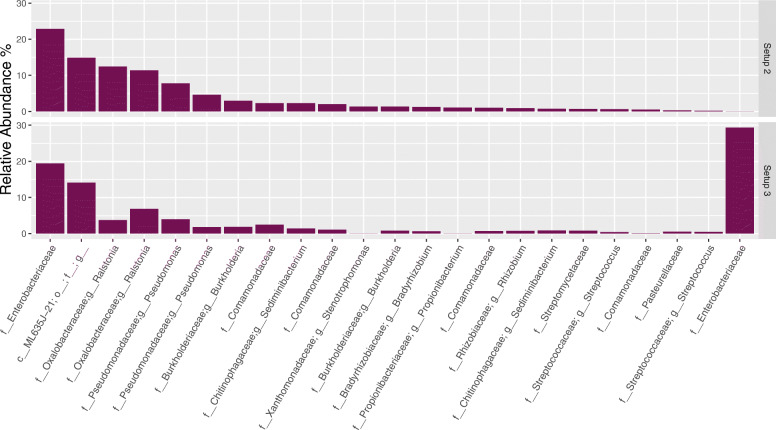
Fig. 3.
Comparison of the 20 most abundant amplicon sequence variants (ASVs) observed in negative control samples (NCS) after sequencing following setups 2 and 3. Taxa presented according to decreasing abundance for ASVs observed following setup 2. Bioinformatic processing steps were performed up the removal of contaminants identified using Decontam. Taxonomic rank is described using prefixes (c__: class, o__: order, f__: family, g__: genus). Setup 2 (2-step PCR; V4 region); Setup 3 (1-step PCR; V4 region). Data is presented as the average relative abundance. Data unrarefied

