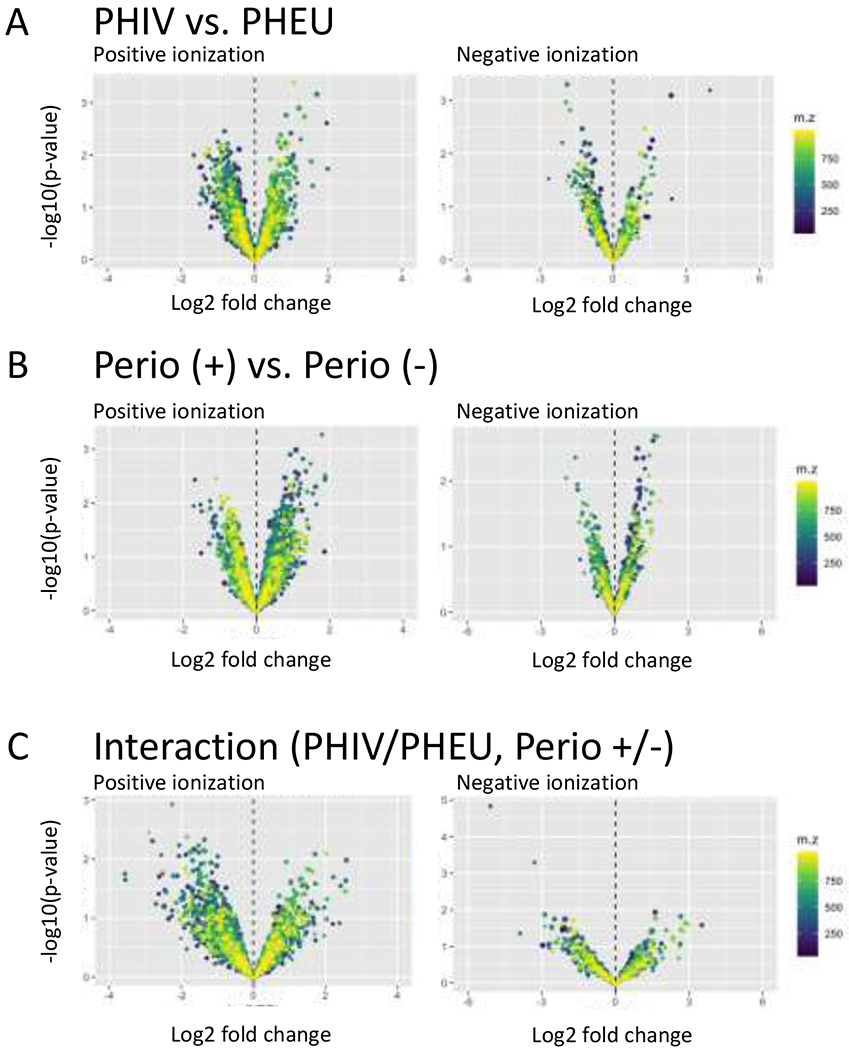
Figure 2.

Global untargeted metabolomics profiling using DDA-MS. Volcano plots display log2 ratios against the −log10 p-values for main effects (A) PHIV vs PHEU and (B) moderate vs. no periodontal disease, and (C) their interaction, with separate plots for metabolites acquired in positive (left) and negative (right) ionization mode. See the footnotes for Table 2 for a precise description of these contrasts.
