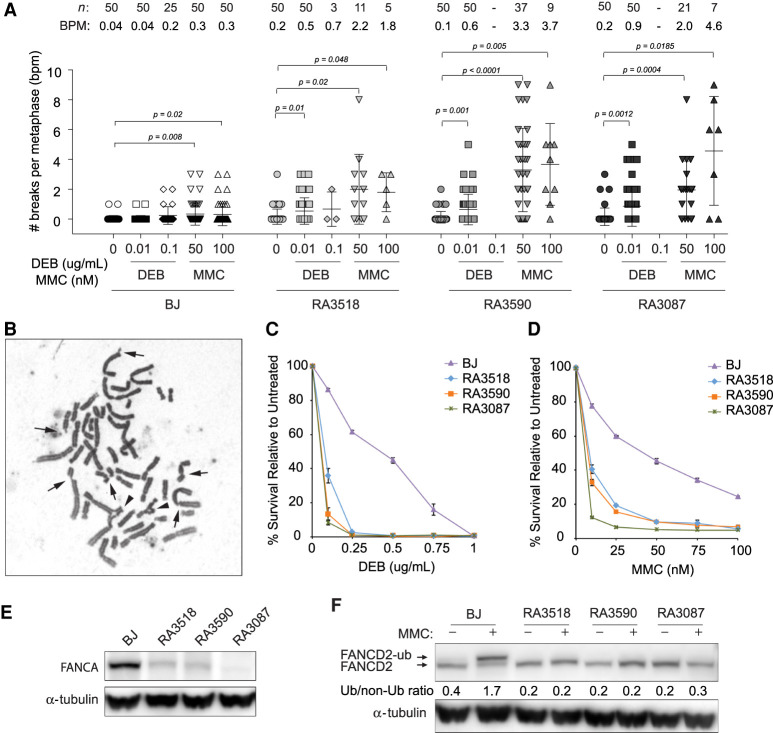
Figure 1.
Characterization of fibroblasts from FA siblings. (A) Quantification of chromosome breaks of diepoxybutane (DEB)-treated and MMC-treated primary fibroblasts from proband (RA3518) and affected sibling (RA3590) in comparison to BJ wild-type and FANCA-deficient primary fibroblasts (RA3087). Number of metaphases analyzed (n) and breaks per metaphase (BPM) are indicated. Welch's unpaired two-tailed parametric t-test was used to determine statistical significance between untreated and treated cells as indicated. (B) Example of a metaphase spread from the proband's primary fibroblasts following 24-h treatment with 50 nM mitomycin C (MMC). Arrows indicate chromosome breaks and the arrowheads highlight radial figures. (C,D) Cellular sensitivity assays of patients’ E6E7 transformed/hTERT immortalized (EH) fibroblasts in comparison to BJ wild-type and FANCA-null EH fibroblasts after DEB or MMC treatment. Cells were treated in triplicate with increasing drug concentrations. Cells were then counted after 7 d and normalized to untreated control to determine percent survival. Error bars represent standard deviation. (E) Western blot for endogenous FANCA in untreated BJ, affected individuals (RA3518 and RA3590), and RA3087 FANCA-deficient primary fibroblasts. (F) Western blot assessing FANCD2 monoubiquitination in BJ, affected individuals (RA3518 and RA3590), and RA3087 FANCA-deficient primary fibroblasts. Cells were either untreated or cultured with 1 µM MMC for 24 h. Slower migrating band represents monoubiquitinated FANCD2. Relative ratio of monoubiquitinated to nonubiquitinated FANCD2 was measured for each variant.

