Figure 1.
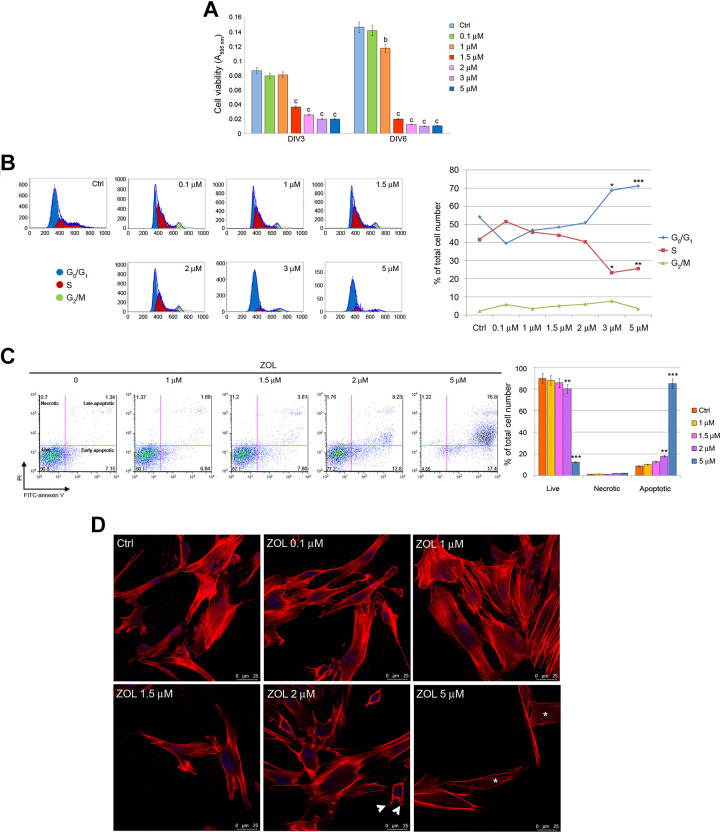
Effects of ZOL on the viability and cell cycle distribution of PDLSCs. MTT analysis of PDLSCs at 3 and 6 days of exposure (A). Flow cytometry analyses of PDLSCs upon 3 days of drug treatment. Representative plots of cells in G1, S, and G2 cell cycle phases are shown. Histogram representative of four independent experiments shows percentage of cells in the different cell cycle phases in the presence or absence of ZOL (B). Representative dot plots of dose-dependent apoptosis increase in PDLSCs after dose escalation of ZOL evaluated with annexin-V/PI assay after 4 days, data analysis are shown in the histogram (C). Representative images of phalloidin staining highlighting F-actin rearrangement after 3 days of treatment; please note the presence of blebs (arrowheads) in cells exposed to 2 μM ZOL as well as the loss of actin stress fibers (asterisks) in cells treated with 5 μM ZOL. Nuclei are indicated in blue. Images were collected using Leica TCS SP8 confocal microscopy system (63×; D). Each assay was performed at least three times on biological replicates. Data are presented as the mean. For statistical analysis, Student’s t test was applied. *, P < 0.05; **/b, P < 0.01; ***/c, P < 0.001; DIV: days in vitro; PDLSCs: periodontal ligament stem cells; PI: propidium iodide; ZOL: zoledronic acid.

