Figure 3.
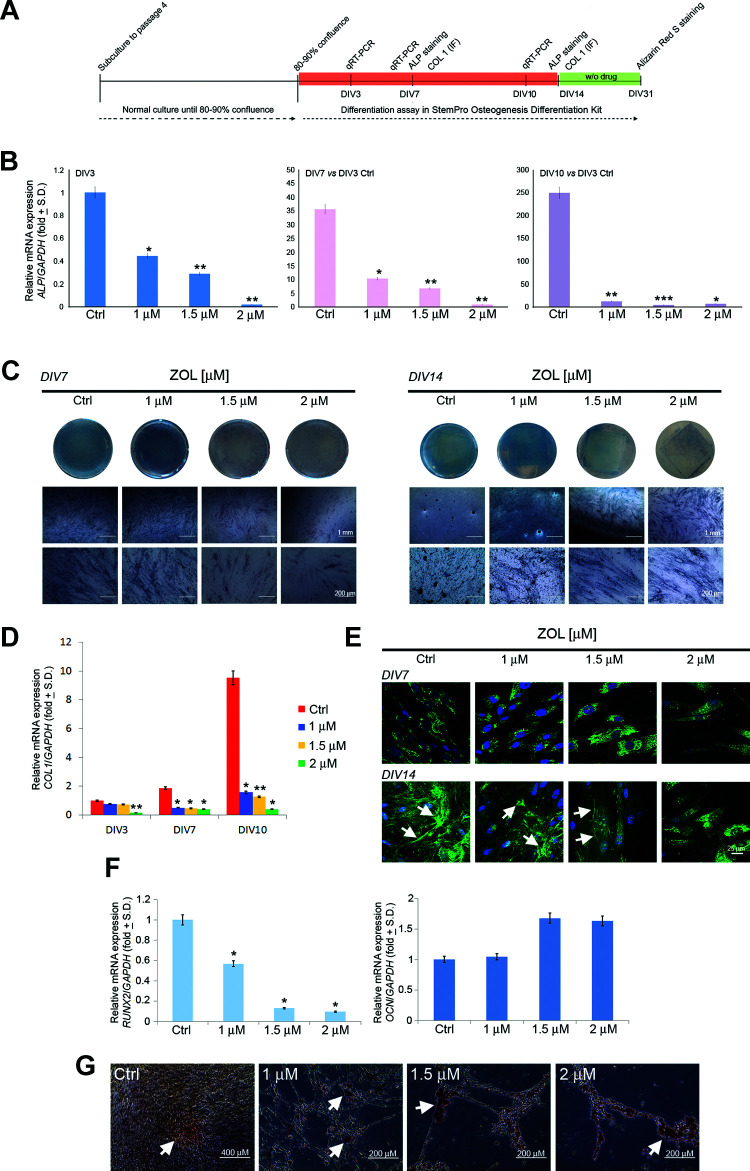
Osteogenic differentiation of PDLSCs after chronic exposure to ZOL. Figure shows the schema of the experimental setup (A). Relative mRNA expression level of ALP at DIV3, DIV7, and DIV10 was normalized to GAPDH and displayed as fold increase or decrease respect to untreated cells at DIV3. Please note the upregulation of ALP mRNA in untreated cells during osteogenic differentiation (B). ALP activity was qualitatively evaluated after 7 and 14 days of osteo-induction (C). Relative mRNA expression level of COL1 at DIV3, DIV7, and DIV10 was normalized to GAPDH and displayed as fold increase or decrease respect to untreated cells at DIV3. Please note the upregulation of COL1 mRNA in untreated cells during osteogenic differentiation (D). Representative images of immunofluorescence analysis of Col1 in PDLSCs untreated and treated with ZOL for 7 and 14 days. Nuclei are indicated in blue. Arrows indicate Col1 deposits in extracellular space. Images were collected using Leica TCS SP8 confocal microscopy system (63×; E). Relative mRNA expression levels of RUNX2 and OCN in PDLSCs after differentiation culture for 10 days (F). Detection of the osteogenic differentiation of PDLSCs by Alizarin Red S (G) staining after 31 days of osteo-induction. Arrows indicate calcium deposits. Each assay was performed at least three times on biological replicates. Data are presented as the mean. For statistical analysis, Student’s t test was applied. *, P < 0.05; **, P < 0.01; ***, P < 0.001. ALP: alkaline phosphatase; COL1: collagen type 1; DIV: days in vitro; OCN: osteocalcin; PDLSC: periodontal ligament stem cell; RUNX2: runt-related transcription factor 2; ZOL: zoledronic acid.

