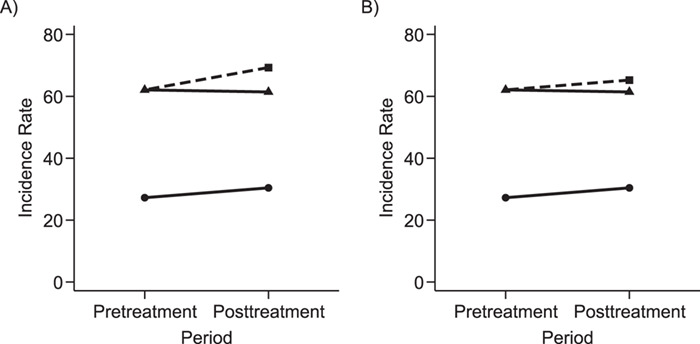
Figure 1.

Graphical depiction of identification using the prior event rate ratio (PERR) and the prior event rate difference (PERD). Observed incidence rates, denoted by circles for the control group and triangles for the treated group (connected by solid lines to highlight the change between the pretreatment and the posttreatment periods), are identical in both panels. The observed incidence rate in the control group  increased from 27.24 in the pretreatment period to 30.41 in the posttreatment period. A) On the multiplicative scale, that is an increase by a factor of 1.12. Using PERR, the counterfactual posttreatment rate in the treated group is estimated to be the observed pretreatment rate, 62.07, increased by the same factor:
  (dashed lines highlight the change between the pretreatment rate and the counterfactual posttreatment rate). B) On the additive scale, the increase in the control group is 3.17. Using PERD, the counterfactual posttreatment rate in the treated group is estimated to be the observed pretreatment rate, 62.07, increased by 3.17, that is
  . All rates are expressed as events per 1,000 person-years. Data for this illustration is from Table 4 in Othman et al. (5).
