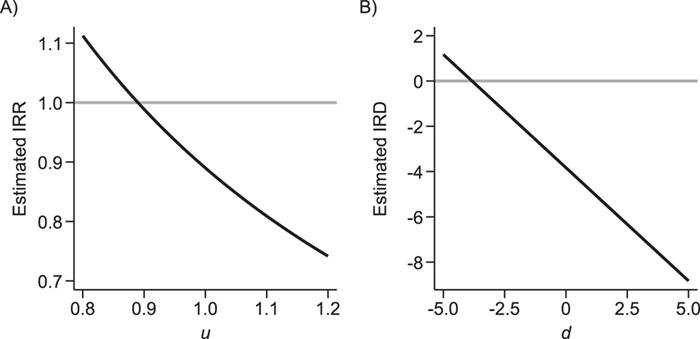
Figure 2.

Sensitivity analysis for prior event rate ratio (PERR) (over different values of u) and prior event rate difference (PERD) (over different values of d). In the PERR analysis, values for u range between 0.8 and 1.2;  represents the primary analysis without adjustment for violations of the common rate-change assumption on the multiplicative scale, and estimates below the gray horizontal line denote benefit from proton pump inhibitors. In the PERD analysis, values for d range between −5 and 5 events per 1,000 person-years;
  represents the primary analysis without adjustment for violations of the common rate-change assumption on the additive scale, and estimates below the gray horizontal line denote benefit from proton pump inhibitors. For the PERD analysis, incidence rate differences are expressed as differences in events per 1,000 person-years. A) Estimated incidence rate ratio (IRR) denotes the estimated
  ; B) estimated incidence rate difference (IRD) denotes the estimated
  . Data for this illustration is from Table 4 in Othman et al. (5).
