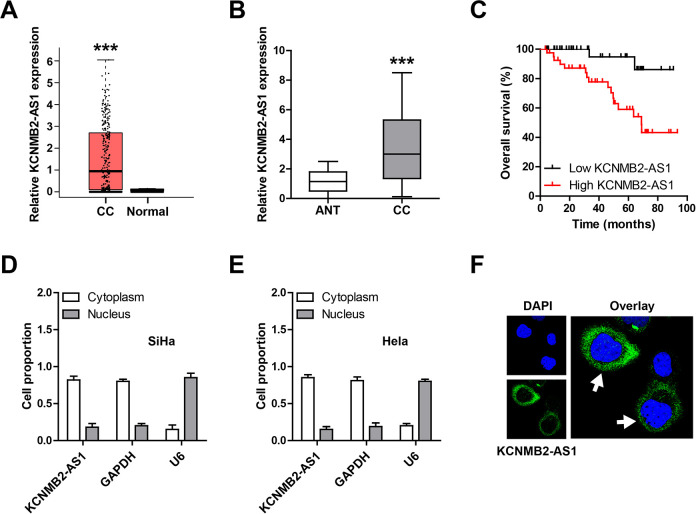
Fig. 1.
The upregulation of KCNMB2-AS1 is identified in CC. (A, B) The expression level of KCNMB2-AS1 in CC and normal tissues from the Gene Expression Profiling Interactive Analysis online tool and our own cohort. (C) The survival curve of CC patients is based on the median KCNMB2-AS1 expression level. (D, E) qRT-PCR analysis of the location of KCNMB2-AS1 in SiHa and HeLa cells (three independent experiments carried out in triplicate). (F) FISH assay showing the cytoplasmic localization of KCNMB2-AS1. The nucleus was stained with 4′,6-diamidino-2-phenylindole. ***P < 0.001. ANT: adjacent normal tissue; CC: cervical cancer; FISH: fluorescence in situ hybridization; qRT-PCR: quantitative real-time polymerase chain reaction.

