Figure 1.

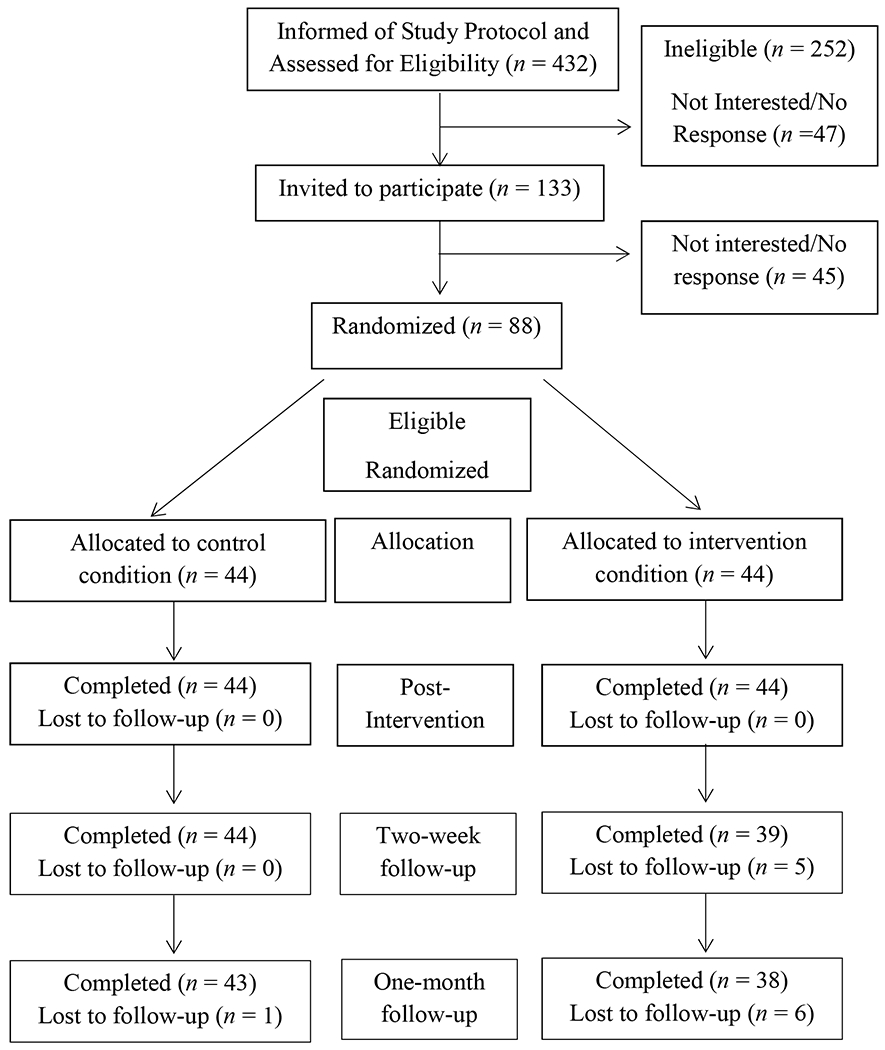
CONSORT Flow Diagram of the progress through the phases of a preventive intervention among two conditions (i.e., enrollment, intervention allocation, post-intervention, and two-week and one-month follow-up).

CONSORT Flow Diagram of the progress through the phases of a preventive intervention among two conditions (i.e., enrollment, intervention allocation, post-intervention, and two-week and one-month follow-up).