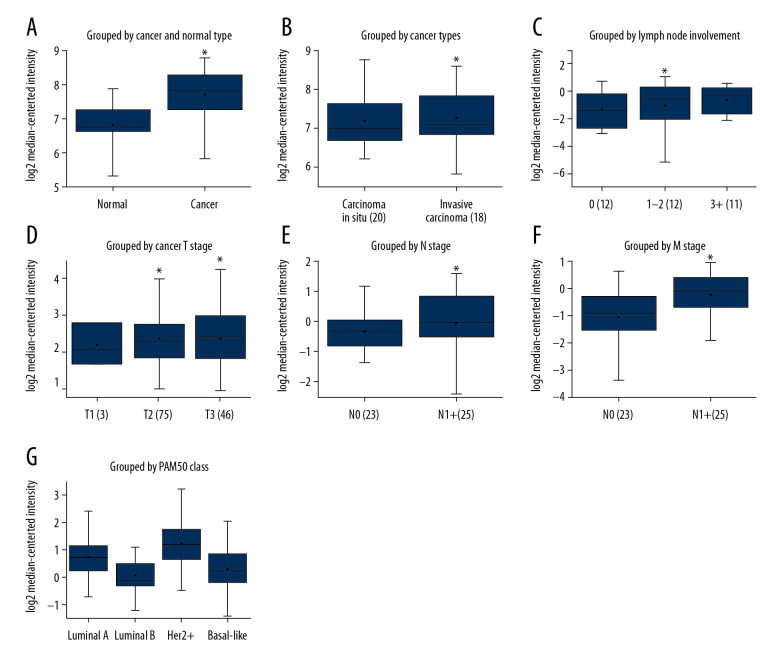
Figure 2.
Boxplots of aspartate β-hydroxylase (ASPH) mRNA expression in breast cancer (BC) extracted from Oncomine. (A) ASPH mRNA expression in BC compared to normal breast tissues in the Ma 4 dataset [36]. (B) ASPH mRNA expression grouped by cancer type in the Ma 4 dataset [36]. (C) ASPH mRNA expression grouped by lymph node involvement in the Radvanyi dataset [37]. (D) ASPH mRNA expression grouped by T stage in the Bonnefoi dataset [38]. (E) ASPH mRNA expression grouped by N stage in the Zhao dataset [39]. (F) ASPH mRNA expression grouped by M stage in the Bonnefoi dataset [38]. (G) ASPH expression in the Esserman dataset grouped by PAM50 Class [40]. * P<0.05 for all comparisons.

