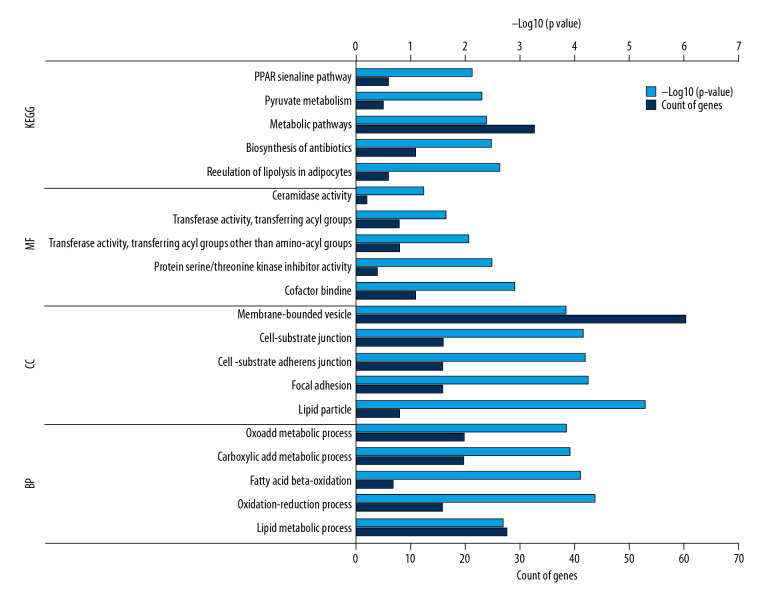
Figure 4.
The top 5 GO terms and KEGG enriched pathways. The horizontal axis represents the count of the enriched genes and P value; the vertical axis represents the enriched GO terms and KEGG pathway. KEGG – Kyoto Encyclopedia of Gene and Genomes; GO – gene ontology; MF – molecular function; CC – cellular component; BP – biological processes.

