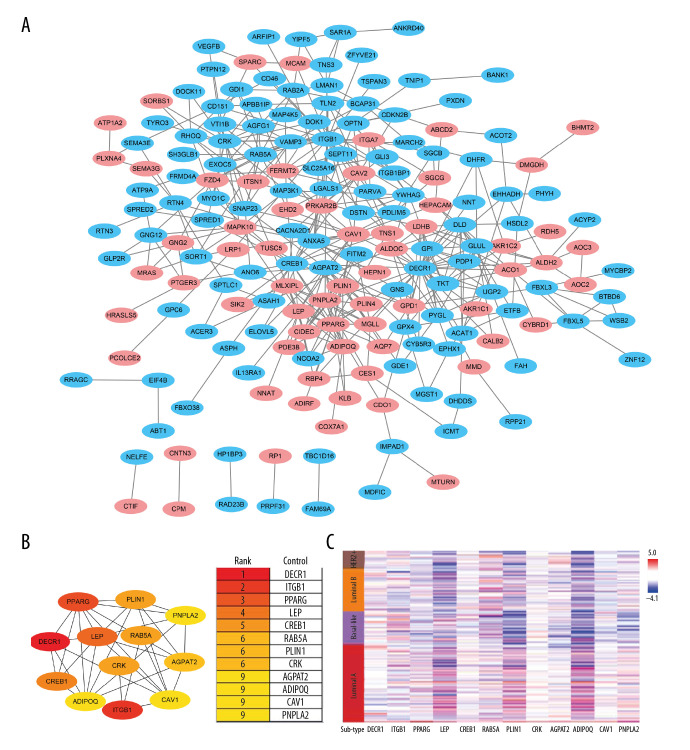
Figure 5.
Protein-protein interaction (PPI) network of the aspartate β-hydroxylase (ASPH)-correlated genes. (A) The PPI network for coexpressed genes constructed using Cytoscape. Pink dots represented the strong ASPH-correlated genes. (B) The rank of the degree of gene connectivity using the cytoHubba plugin represented by different degrees of color (from red to yellow). (C) Heat map analysis showing the correlation of molecular subtypes with the hub genes.

