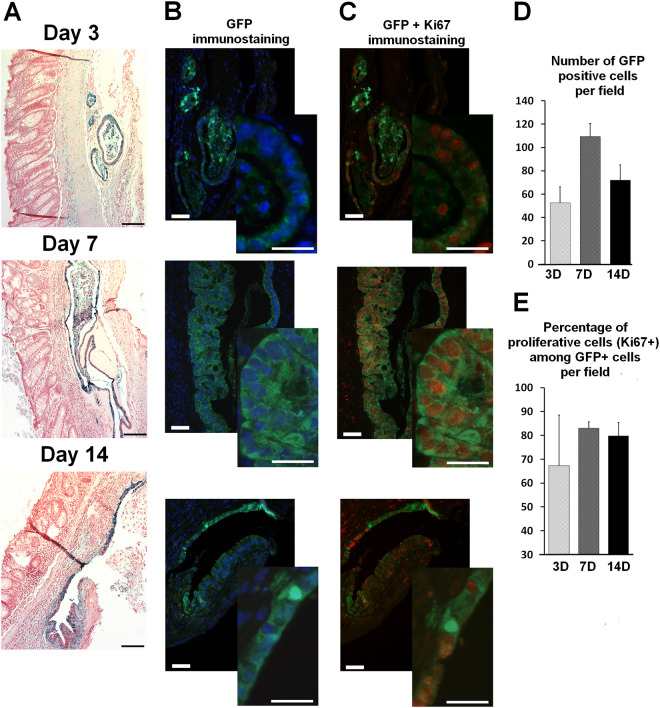
Figure 2.
GFP-ECO from cultured colonoids implant and proliferate in colonic mucosa with chronic lesions at 3, 7 and 14 days after injection. (A) Large view pictures of engrafted ECO-GFP in colonic mucosa (GFP immunostaining in blue). Scale bars represent 100 µm. (B) GFP immunostaining merged with DAPI (low and enhanced-power views). (C) Co-immunostaining of GFP (green) and Ki-67 (red) (low and enhanced-power views). Scale bars for low power views represent 25 µm and enhance power views represent 50 µm. (D) Quantification of the number of injected GFP-ECO per field. (E) Quantification of the number of proliferative cells among the GFP-positive-ECO per field. All results are expressed as mean ± SEM.

