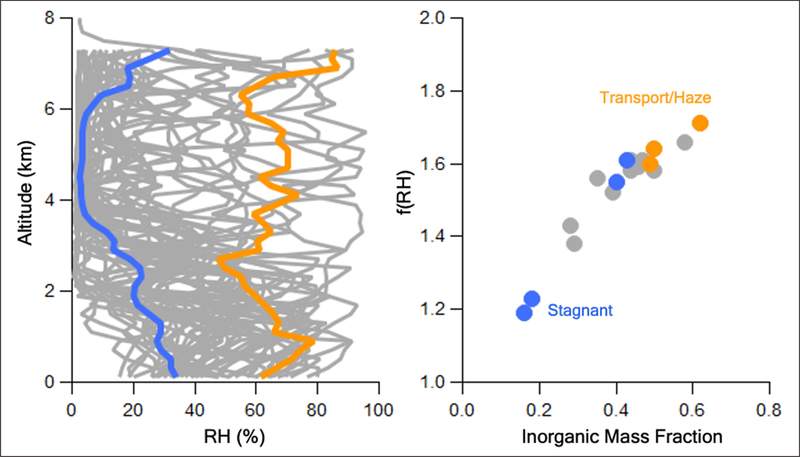
Figure 10:
Left panel: All DC-8 vertical profiles of RH (gray curves) over Seoul during KORUS-AQ with mean profiles for Stagnant (blue) and Transport/Haze (orange) periods. Right panel: mean f(RH) and inorganic aerosol mass fraction over Seoul for each flight day (Stagnant flight days in blue, Transport/Haze in orange). The Stagnant mean includes data collected from Seoul spirals on May17th, 18th, 20th, and 22nd, while the Transport/Haze mean includes one spiral from May 25th and two on May 26th. DOI: https://doi.org/10.1525/elementa.424.f10

