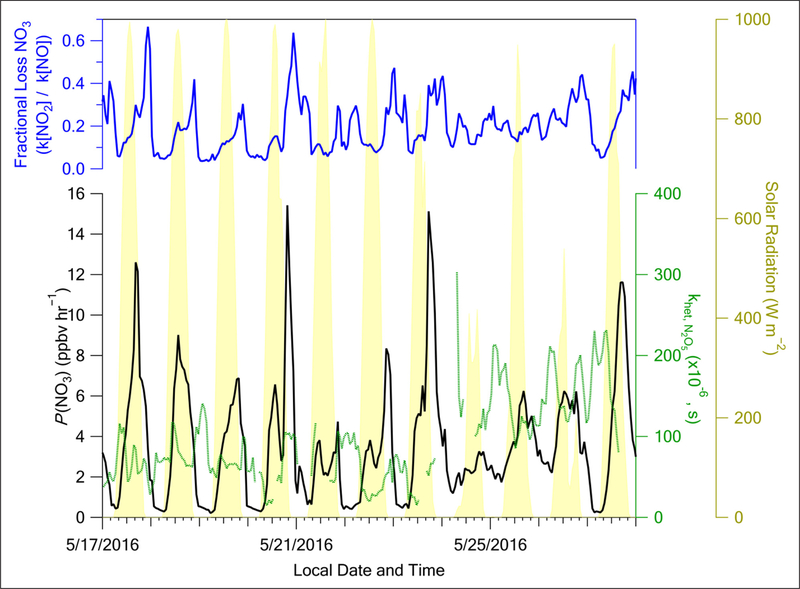
Figure 13:
Top blue curve: fraction of the NO3 radical lost via its reaction with NO2 (reaction R3 in text) versus NO (reaction R6 in text). Lower black curve: production of the NO3 radical (P(NO3) in ppbv/hr). Lower dotted green curve: heterogeneous reaction rate of N2O5. Shaded yellow curve: solar radiation (W/m2). DOI: https://doi.org/10.1525/elementa.424.f13

