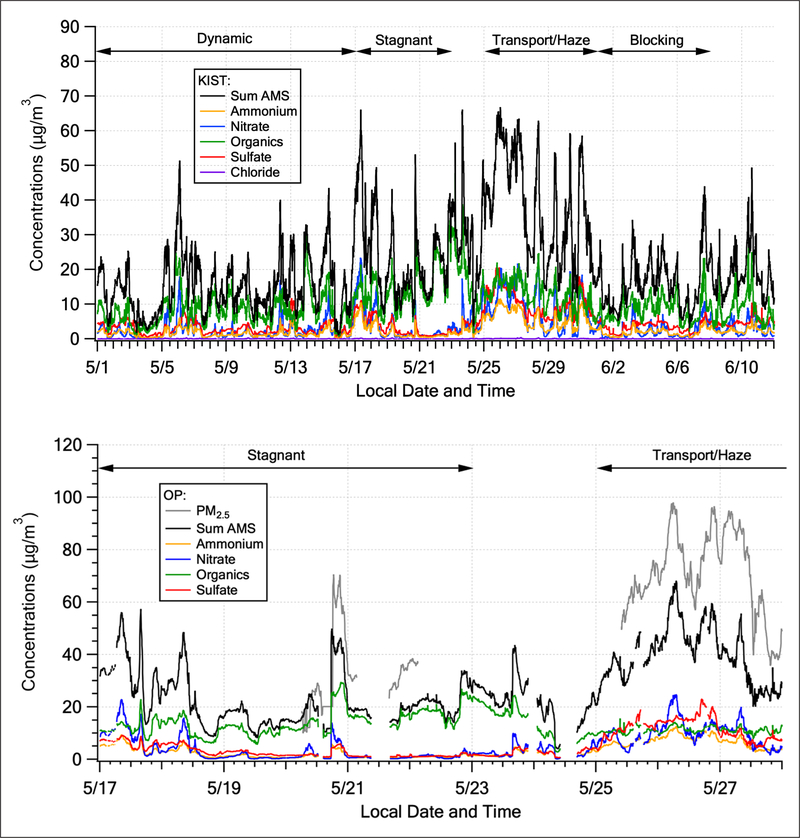
Figure 9:
Top panel: campaign time series of KIST AMS data shown with meteorological periods annotated at the top of the figure as in Fig. 2. The sum of the individual constituents (black) is used as a proxy for PM1 aerosol over the entire KORUS-AQ campaign. Bottom panel: Olympic Park AMS Stagnant and 1st half of Transport/Haze periods only, along with 5 min PM2.5 concentrations. DOI: https://doi.org/10.1525/elementa.424.f9

