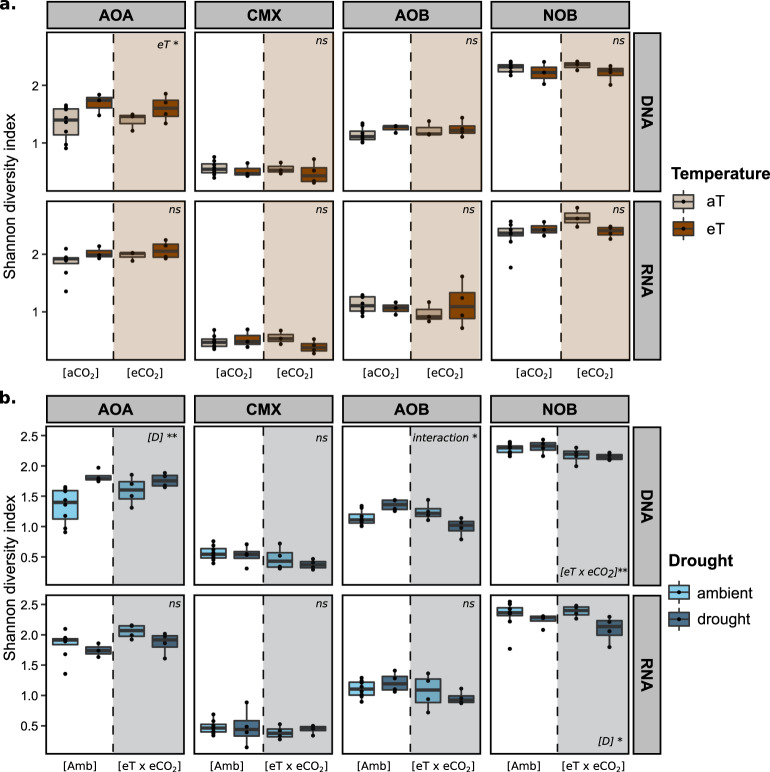
Fig. 2. Shannon diversity index based on amoA/nxrB gene and transcript sequences from all microbial groups.
a Quantifications from plots affected by elevated temperature (eT) and atmospheric CO2 concentrations (eCO2). The dashed lines represent plots affected by elevated atmospheric CO2 conditions (eCO2). The colors represent plots affected by either ambient temperature (aT) or elevated temperature (eT). b Quantifications from plots affected by future climate (eT x eCO2) and drought (D). The dashed lines separate plots affected by drought (D). The colors represent the drought treatment. The caption on the upper right corner of each subplot represents the ANOVA results. *p value <0.05; **p value <0.01. Whenever the ANOVA results showed a significant interaction term, lsmeans multiple comparison tests were ran. For details on the ANOVA and post-hoc tests, see Tables S2 and S3.

