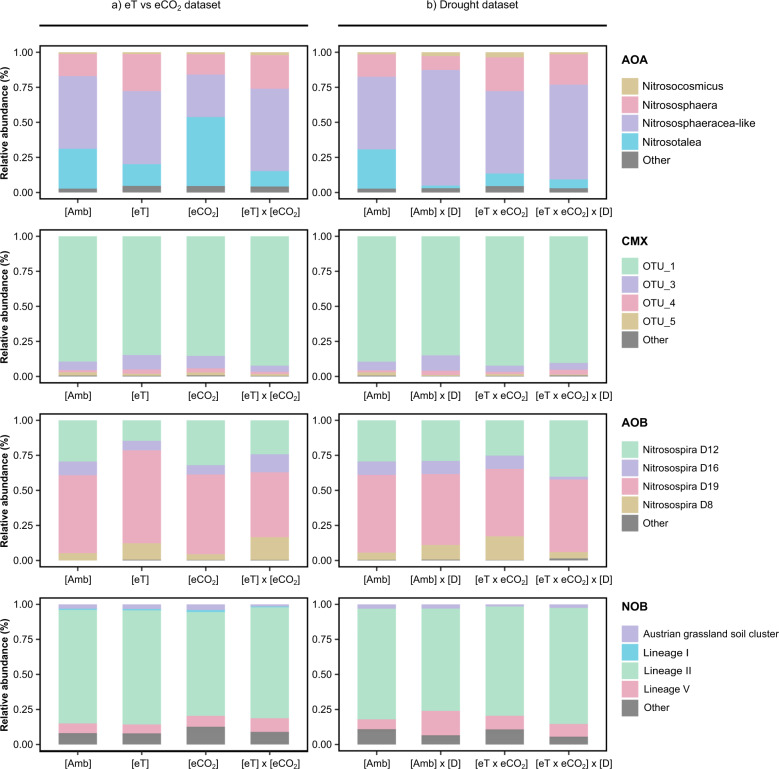
Fig. 3. Relative abundance (%) of all nitrifying groups obtained by amoA and nxrB transcript sequences.
a Data for plots affected by single and interactive effects of elevated temperature (eT) and atmospheric CO2 (eCO2) concentrations. b Plots affected by single and interactive effects of future climate conditions (eT x eCO2) and drought (D). The color code represents different genera/OTU/clades/lineages. “Amb” stands for “ambient conditions”. Multiple horizontal lines within the same color represent individual OTUs within a group. Taxa that comprised <0.1% of all reads per treatment are grouped as “Other”.

