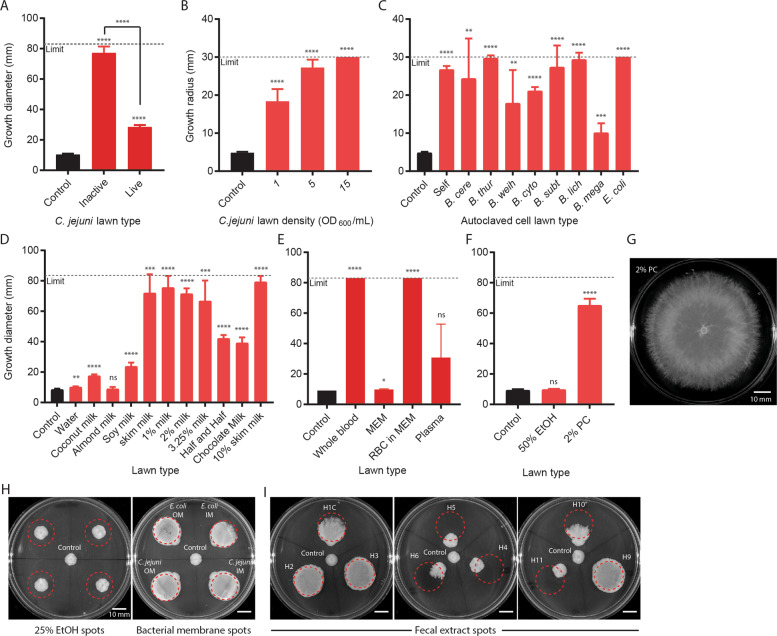
Fig. 3. Conditions that induced filamentous expansion.
a Comparison of inactive (pre-prepared plates) and live (fresh plates) C. jejuni cell lawns that induced ML-A2C4 spreading after microaerobic incubation at 38 °C (n = 5). b ML-A2C4 expansion on adsorbed C. jejuni cell lawns prepared by autoclaving cells at various densities (n = 8). The measurement limit is lower because the cell lawns were applied onto MH plates as small ~30 mm diameter spots. ML-A2C4 was inoculated at the edge of the lawn. c ML-A2C4 expansion on 15 OD600/mL autoclaved cell lawns of multiple cell types including itself (“self”) (n = 8). Shortened species names listed in order are: B. cereus, B. thuringiensis, B. weihenstephanensis, B. cytotoxicus, B. subtilis, B. licheniformis, B. megaterium, and E. coli. ML-A2C4 expansion on multiple types of milk products (d), blood products (e), and phosphatidylcholine (PC; f, g) (n = 5). MEM minimal essential medium, RBC red blood cell, EtOH ethanol. h Representative plates from n = 3 testing of ML-A2C4 growth on 25% EtOH spots (left) and E. coli and C. jejuni inner membrane (IM) and outer membrane (OM) preparations. i Representative plates from n = 3 testing of ML-A2C4 growth on nine human fecal extracts (left: H1C, H2, and H3; center: H4, H5, and H6; right: H9, H10, and H11). Dotted lines in h and i indicate area where substrate was dried onto the plate. As a control, ML-A2C4 was spotted in the middle of plates shown in h and i where there was no substrate. All data shown were taken after 48 h incubation. Statistical analysis was performed for growth diameter on C. jejuni lawn plates versus control plates where indicated using the Student’s t test with Welch’s correction. p values are represented as: ****p < 0.0001, ***p < 0.001, **p < 0.01, *p < 0.05, ns not significant.

