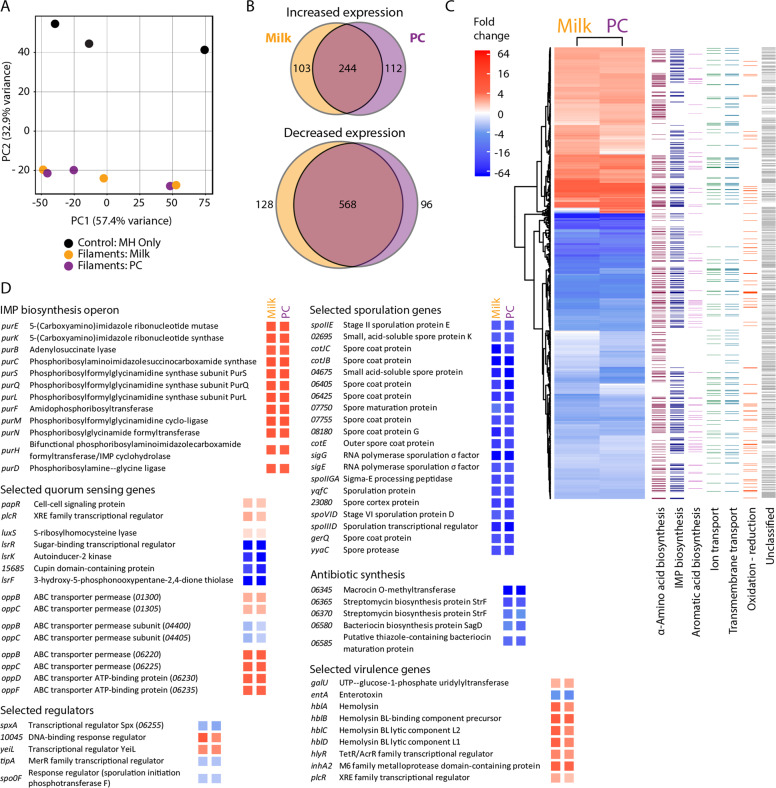
Fig. 6. Differential expression in filamentous motility expanding cf. control colonies.
a Principle component analysis of control cells (black), filamentous cells on 10% skim milk lawns (orange) and on PC lawns (purple). b Venn diagrams of genes that showed increased (top) and decreased (bottom) transcription during filamentous expansion in comparison with control cells. c Heat map of all differently transcribed genes during filamentous growth in milk and PC (wide columns) and the gene ontology (GO) categories assigned to those genes (thin columns). d Lists of differently transcribed genes organized based on predicted function with the fold change represented as a colored box corresponding to the fold change scale in the heat map.

